Technical Analysis of WFHY 2024-05-31
Overview:
In analyzing the technical indicators for WFHY over the last 5 days, we will delve into the trend, momentum, volatility, and volume indicators to provide a comprehensive outlook on the possible stock price movement. By examining these key aspects, we aim to offer valuable insights and predictions for the upcoming days.
Trend Analysis:
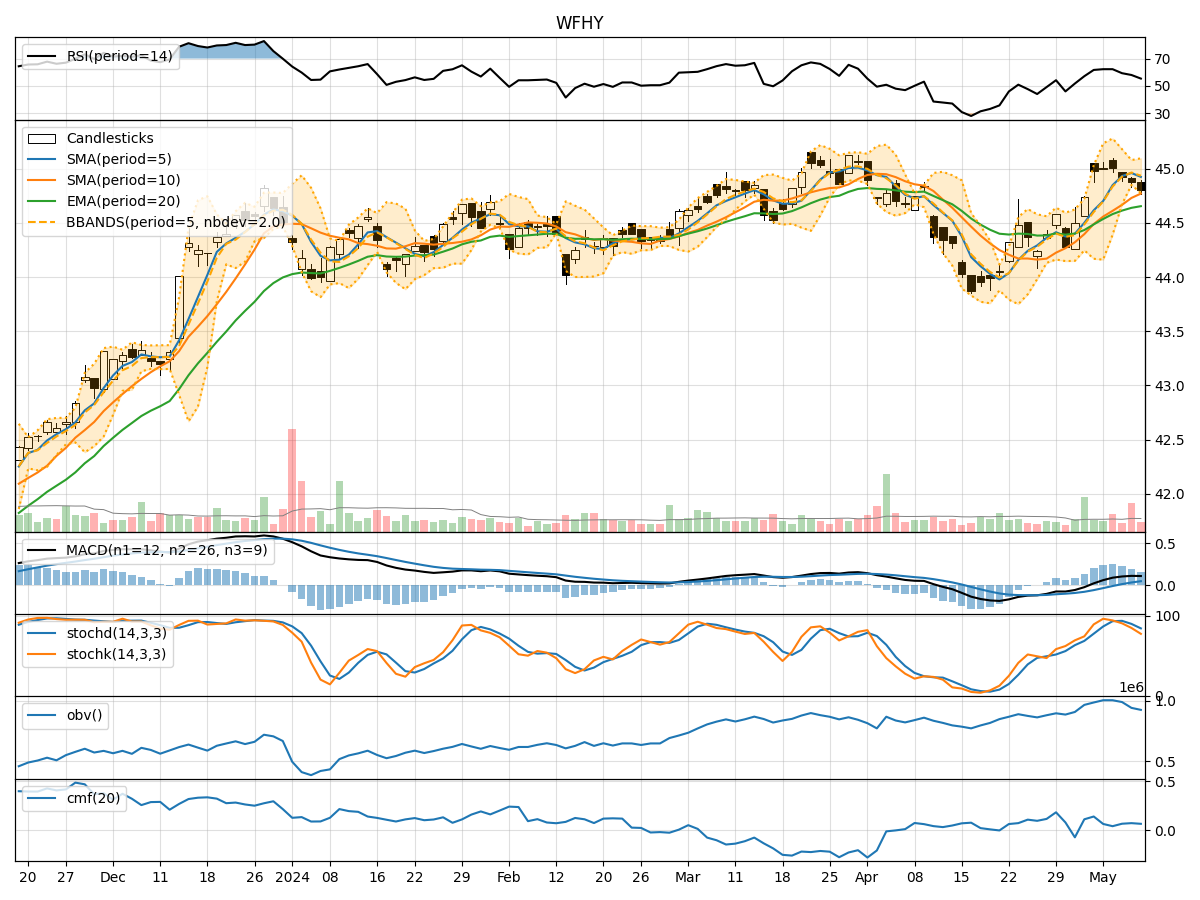
- Moving Averages (MA): The 5-day Moving Average (MA) has been gradually decreasing, indicating a short-term bearish trend.
- MACD: The MACD line has been consistently positive, but the MACD Histogram has been decreasing, suggesting a potential weakening of the bullish momentum.
- EMA: The Exponential Moving Average (EMA) has been declining, aligning with the bearish sentiment in the short term.
Momentum Analysis:
- RSI: The Relative Strength Index (RSI) has been fluctuating around the neutral zone, indicating indecision in the market.
- Stochastic Oscillator: Both %K and %D have been relatively low, signaling a potential oversold condition.
- Williams %R: The Williams %R is hovering in the oversold territory, suggesting a possible reversal in the near future.
Volatility Analysis:
- Bollinger Bands (BB): The Bollinger Bands have been narrowing, indicating decreasing volatility in the stock price.
- Bollinger %B: The %B indicator has been fluctuating within a tight range, reflecting the consolidation phase.
- Average True Range (ATR): The ATR has been decreasing, pointing towards reduced price fluctuations.
Volume Analysis:
- On-Balance Volume (OBV): The OBV has shown a slight increase, suggesting some accumulation by investors.
- Chaikin Money Flow (CMF): The CMF has been negative, indicating outflow of money from the stock.
Key Observations:
- The stock is currently in a downtrend based on the moving averages and EMA.
- Momentum indicators suggest a potential reversal as the stock is nearing oversold levels.
- Volatility has been decreasing, indicating a consolidation phase.
- Volume indicators show a mixed sentiment with slight accumulation but overall negative money flow.
Conclusion:
Based on the analysis of the technical indicators, the next few days for WFHY are likely to see further downside movement in the stock price. The bearish trend indicated by the moving averages and EMA, coupled with the potential reversal signal from momentum indicators, suggests that the stock may experience a continued downward trajectory. Investors should exercise caution and consider waiting for more definitive signals before making any trading decisions.