Technical Analysis of WUGI 2024-05-31
Overview:
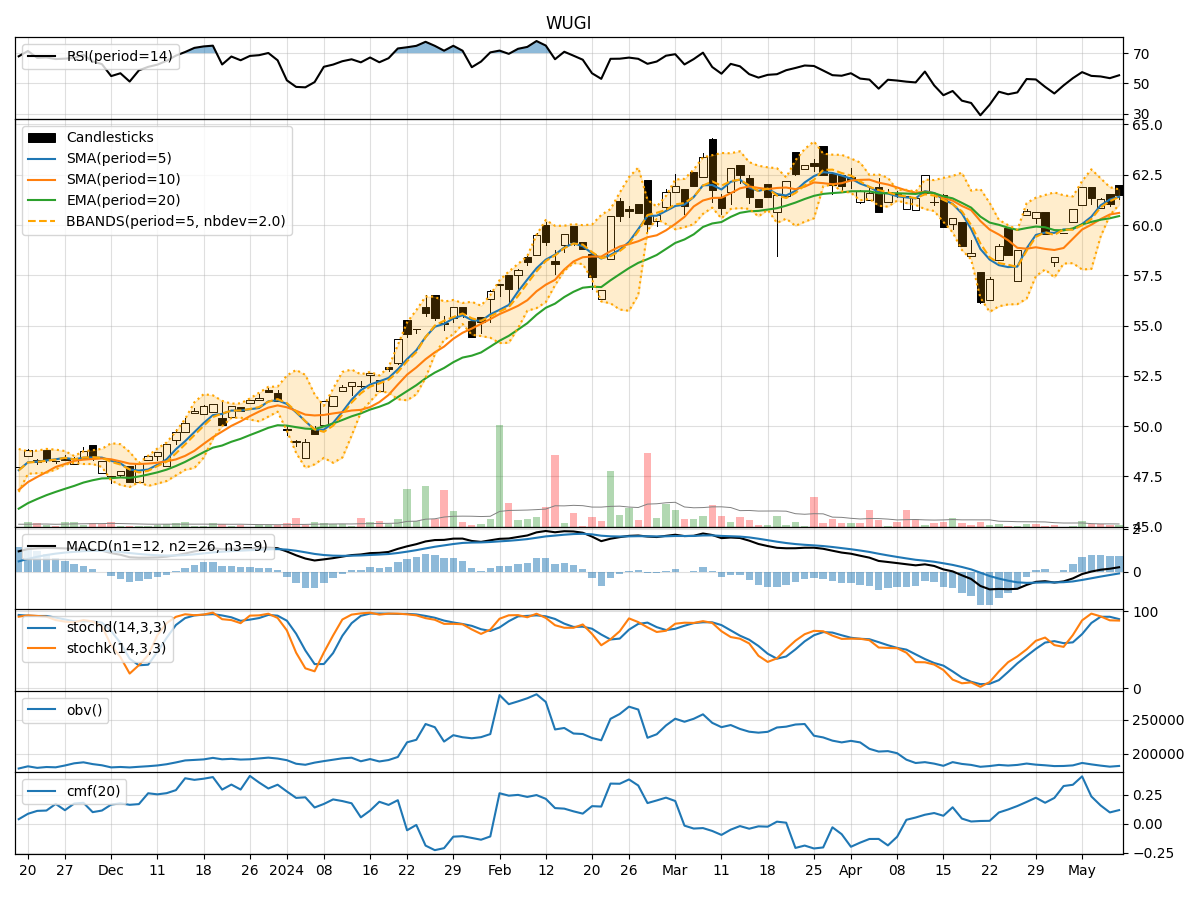
In analyzing the technical indicators for WUGI over the last 5 days, we will delve into the trend, momentum, volatility, and volume indicators to provide a comprehensive outlook on the possible stock price movement in the coming days.
Trend Analysis:
- Moving Averages (MA): The 5-day Moving Average (MA) has been consistently above the Simple Moving Average (SMA) and Exponential Moving Average (EMA), indicating a bullish trend.
- MACD: The MACD line has been above the signal line, with both lines showing an upward trend, suggesting bullish momentum.
- RSI: The Relative Strength Index (RSI) has been fluctuating but generally staying above 50, indicating bullish sentiment.
Momentum Analysis:
- Stochastic Oscillator: The Stochastic Oscillator has been in the overbought territory, suggesting a potential reversal or consolidation.
- Williams %R: The Williams %R has been in the oversold region, indicating a possible buying opportunity.
Volatility Analysis:
- Bollinger Bands (BB): The stock price has been trading within the Bollinger Bands, with the bands narrowing, indicating decreasing volatility.
- BB %B: The %B indicator has been relatively stable, suggesting a lack of extreme price movements.
Volume Analysis:
- On-Balance Volume (OBV): The OBV has been fluctuating but generally showing a slight decrease, indicating some distribution.
- Chaikin Money Flow (CMF): The CMF has been positive, indicating buying pressure in the stock.
Key Observations:
- The trend indicators suggest a bullish sentiment in the short term.
- Momentum indicators show conflicting signals with the Stochastic Oscillator in overbought territory and Williams %R in oversold territory.
- Volatility is decreasing, indicating a possible period of consolidation.
- Volume indicators show a slight decrease in buying pressure.
Conclusion:
Based on the analysis of the technical indicators, the next few days for WUGI stock price movement could see sideways consolidation with a slight upward bias. Traders may consider monitoring the Stochastic Oscillator for a potential reversal signal and the OBV for any significant changes in volume accumulation. It is advisable to exercise caution and wait for clearer signals before making significant trading decisions.