Technical Analysis of XBJL 2024-05-31
Overview:
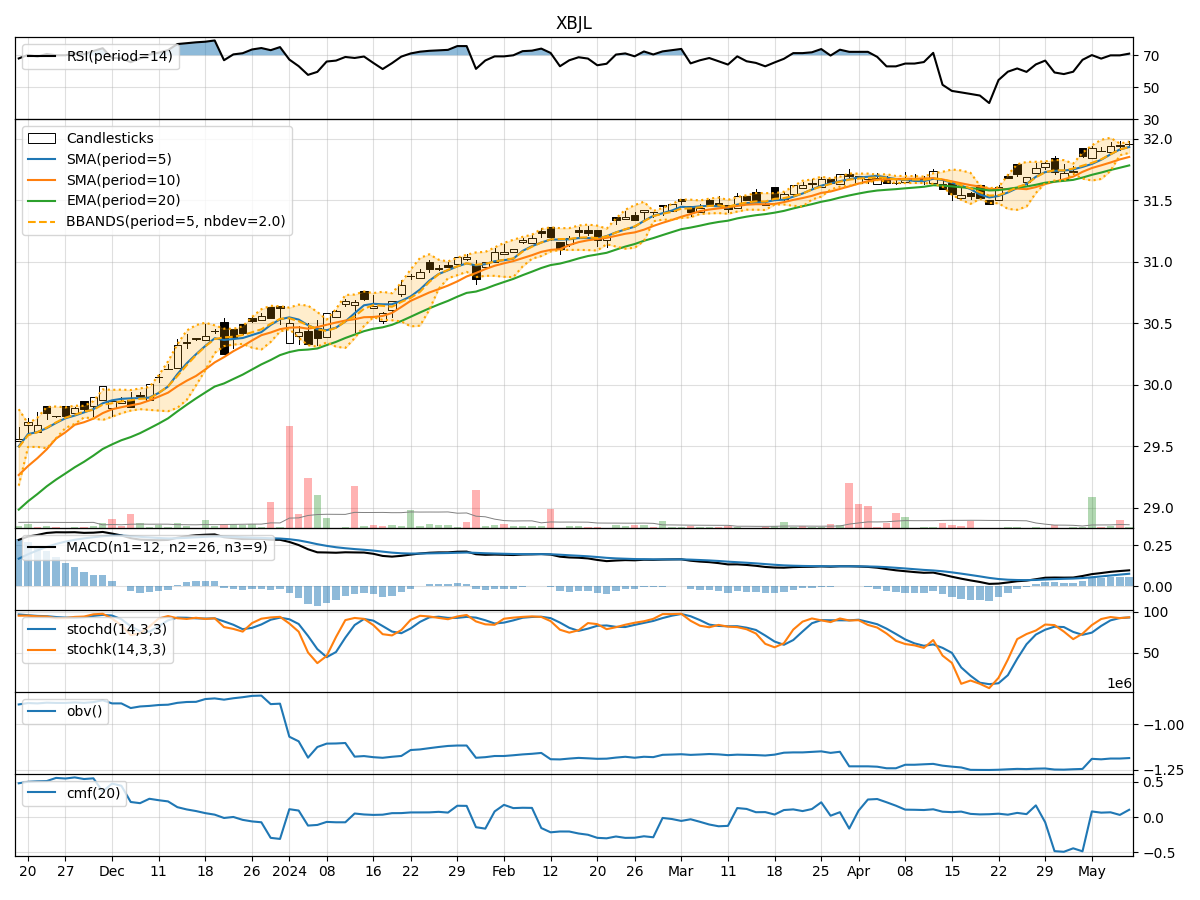
In analyzing the technical indicators for XBJL over the last 5 days, we will delve into the trend, momentum, volatility, and volume indicators to provide a comprehensive outlook on the possible stock price movement in the coming days. By examining these key indicators, we aim to offer valuable insights and predictions for informed decision-making.
Trend Analysis:
- Moving Averages (MA): The 5-day MA has been consistently above the closing price, indicating a short-term uptrend.
- MACD: The MACD line has been positive, suggesting bullish momentum.
- EMA: The EMA has been trending upwards, supporting the bullish sentiment.
Key Observation: The trend indicators point towards an upward trend in the stock price.
Momentum Analysis:
- RSI: The RSI has been in the overbought territory, indicating strong buying momentum.
- Stochastic Oscillator: Both %K and %D have been decreasing, signaling a potential reversal in momentum.
- Williams %R: The indicator has been in the oversold region, suggesting a possible reversal.
Key Observation: Momentum indicators show a mixed signal with potential for a reversal in momentum.
Volatility Analysis:
- Bollinger Bands (BB): The stock price has been trading within the bands, indicating stable volatility.
- Bollinger %B: The %B has been fluctuating around 1.0, suggesting normal volatility levels.
Key Observation: Volatility indicators suggest stable price movement with no extreme fluctuations.
Volume Analysis:
- On-Balance Volume (OBV): The OBV has been relatively flat, indicating no significant divergence between price and volume.
- Chaikin Money Flow (CMF): The CMF has been positive, reflecting buying pressure.
Key Observation: Volume indicators imply neutral volume activity with a slight bullish bias.
Conclusion:
Based on the analysis of the technical indicators, the stock of XBJL is likely to experience upward price movement in the coming days, supported by the bullish trend indicators. However, the mixed signals from momentum indicators suggest a potential reversal in momentum, which could lead to short-term fluctuations. The stable volatility and neutral volume activity further support the outlook for a moderate price increase. Traders should closely monitor the momentum indicators for any signs of a reversal in trend.