Technical Analysis of XTL 2024-05-31
Overview:
In analyzing the technical indicators for XTL over the last 5 days, we will delve into the trend, momentum, volatility, and volume indicators to provide a comprehensive outlook on the possible stock price movement. By examining these key aspects, we aim to offer valuable insights and predictions for the upcoming days.
Trend Analysis:
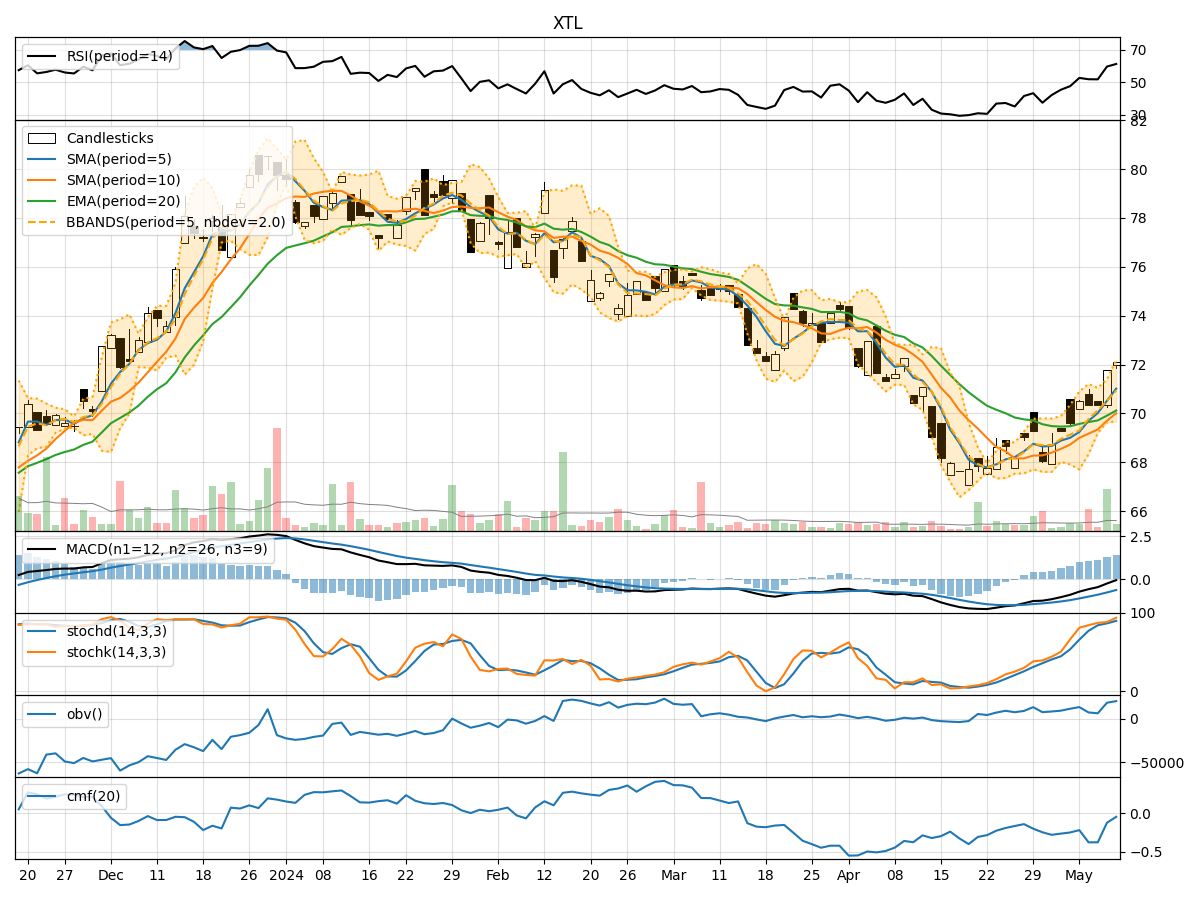
- Moving Averages (MA): The 5-day Moving Average (MA) has been fluctuating around the closing prices, indicating short-term price trends. The Simple Moving Average (SMA) and Exponential Moving Average (EMA) have shown an upward trend, suggesting a bullish sentiment.
- Moving Average Convergence Divergence (MACD): The MACD and Signal Line have been consistently positive, with the MACD Histogram showing an increasing trend. This signals a strong bullish momentum in the stock.
Momentum Analysis:
- Relative Strength Index (RSI): The RSI has been gradually increasing and is currently in the overbought territory, indicating a bullish momentum.
- Stochastic Oscillator: Both %K and %D lines of the Stochastic Oscillator have been rising, reaching high levels, which suggests a strong bullish momentum.
- Williams %R (Willams %R): The Williams %R is in the oversold region, indicating a potential reversal or consolidation phase.
Volatility Analysis:
- Bollinger Bands (BB): The Bollinger Bands have been widening, indicating increased volatility in the stock price. The current price is closer to the upper band, suggesting a bullish sentiment.
- Bollinger Band %B (BB %B): The %B value is above 0.5, indicating a bullish trend in the short term.
Volume Analysis:
- On-Balance Volume (OBV): The OBV has been steadily increasing over the past 5 days, reflecting strong buying pressure and accumulation of the stock.
- Chaikin Money Flow (CMF): The CMF has been positive and rising, indicating that money is flowing into the stock, supporting the bullish sentiment.
Key Observations:
- The trend indicators, momentum oscillators, and volume indicators all point towards a strong bullish sentiment in XTL.
- The stock is currently in an upward trend, supported by increasing moving averages, positive MACD, and rising RSI and Stochastic indicators.
- Volatility has increased, but the Bollinger Bands suggest that the stock price may continue to rise in the short term.
- The volume indicators confirm the bullish outlook, with increasing OBV and positive CMF values.
Conclusion:
Based on the comprehensive analysis of the technical indicators, it is highly likely that XTL will experience further upward movement in the next few days. Traders and investors may consider buying opportunities in XTL, as the overall technical outlook is bullish. It is important to monitor the price action closely and set appropriate stop-loss levels to manage risk effectively.