Technical Analysis of SVM 2024-05-31
Overview:
In analyzing the technical indicators for the stock in question over the last 5 days, we will delve into the trend, momentum, volatility, and volume indicators to provide a comprehensive assessment. By examining these key aspects, we aim to offer insights into the possible future stock price movements.
Trend Analysis:
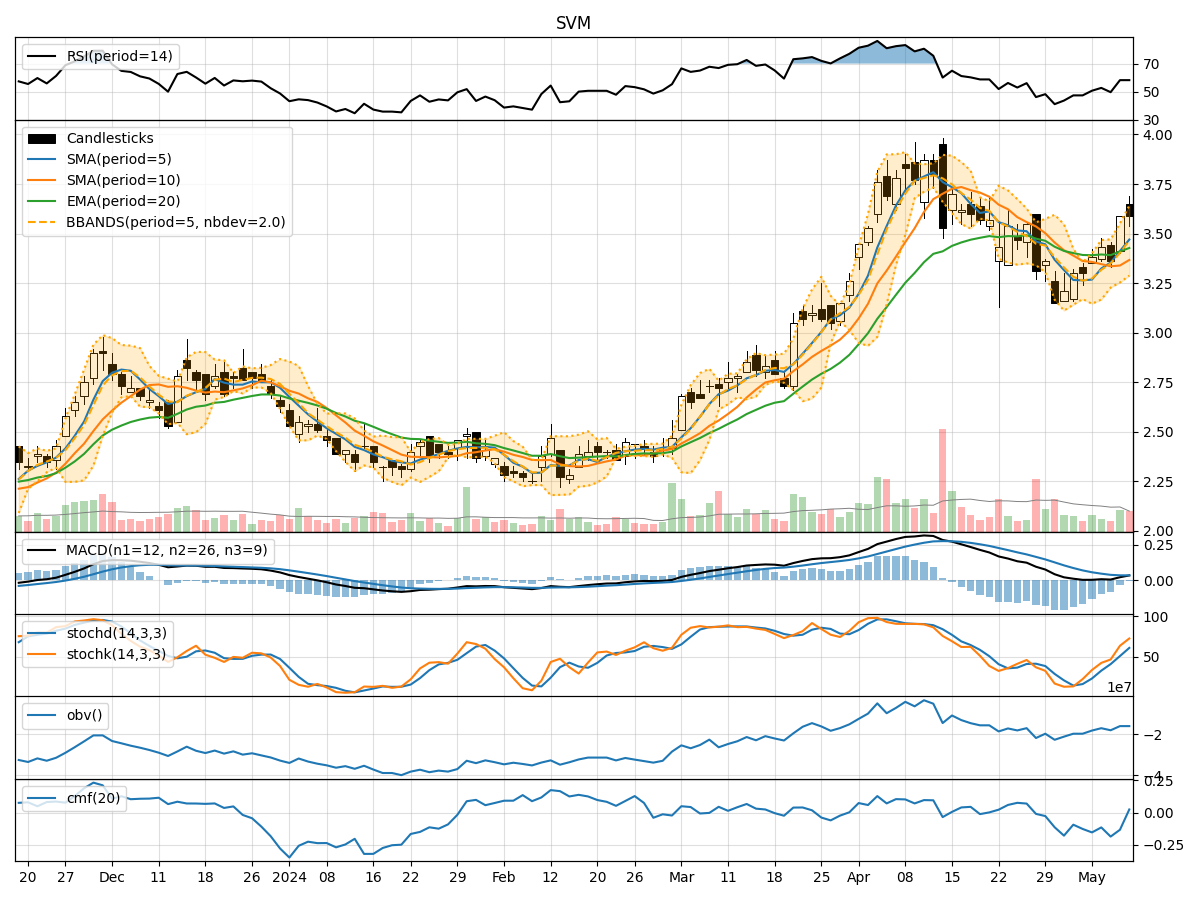
- Moving Averages (MA): The 5-day Moving Average (MA) has been showing an upward trend, indicating a positive momentum in the stock price.
- MACD and Signal Line: The MACD line has been consistently above the Signal Line, suggesting a bullish trend in the stock.
- Relative Strength Index (RSI): The RSI values have been fluctuating but generally staying above 50, indicating a bullish sentiment in the market.
Momentum Analysis:
- Stochastic Oscillator: The Stochastic Oscillator has been fluctuating but generally staying in the overbought territory, suggesting a potential reversal or consolidation phase.
- Williams %R (Willams %R): The Williams %R has been consistently in the oversold territory, indicating a bearish sentiment in the market.
Volatility Analysis:
- Bollinger Bands (BB): The Bollinger Bands have been narrowing, indicating decreasing volatility in the stock price.
- Average True Range (ATR): The ATR values have been decreasing, suggesting a decrease in price volatility.
Volume Analysis:
- On-Balance Volume (OBV): The OBV has been showing mixed signals, indicating indecision among investors regarding the stock.
- Chaikin Money Flow (CMF): The CMF has been positive, suggesting that money is flowing into the stock.
Key Observations:
- The trend indicators suggest a bullish sentiment in the stock, supported by the moving averages and MACD.
- Momentum indicators show conflicting signals, with the Stochastic Oscillator indicating overbought conditions and the Williams %R showing oversold conditions.
- Volatility indicators point towards decreasing volatility in the stock price, potentially leading to a period of consolidation.
- Volume indicators reflect mixed signals, indicating uncertainty among investors regarding the stock's future direction.
Conclusion:
Based on the analysis of the technical indicators, the stock is likely to experience sideways movement or consolidation in the near future. The bullish trend indicated by the moving averages and MACD may be offset by the conflicting signals from the momentum indicators. The decreasing volatility and mixed volume signals further support the view of a potential consolidation phase. Investors should closely monitor the price action and key support and resistance levels for potential trading opportunities.