Technical Analysis of TRX 2024-05-31
Overview:
In analyzing the technical indicators for TRX over the last 5 days, we will delve into the trend, momentum, volatility, and volume indicators to provide a comprehensive outlook on the possible stock price movement in the coming days.
Trend Analysis:
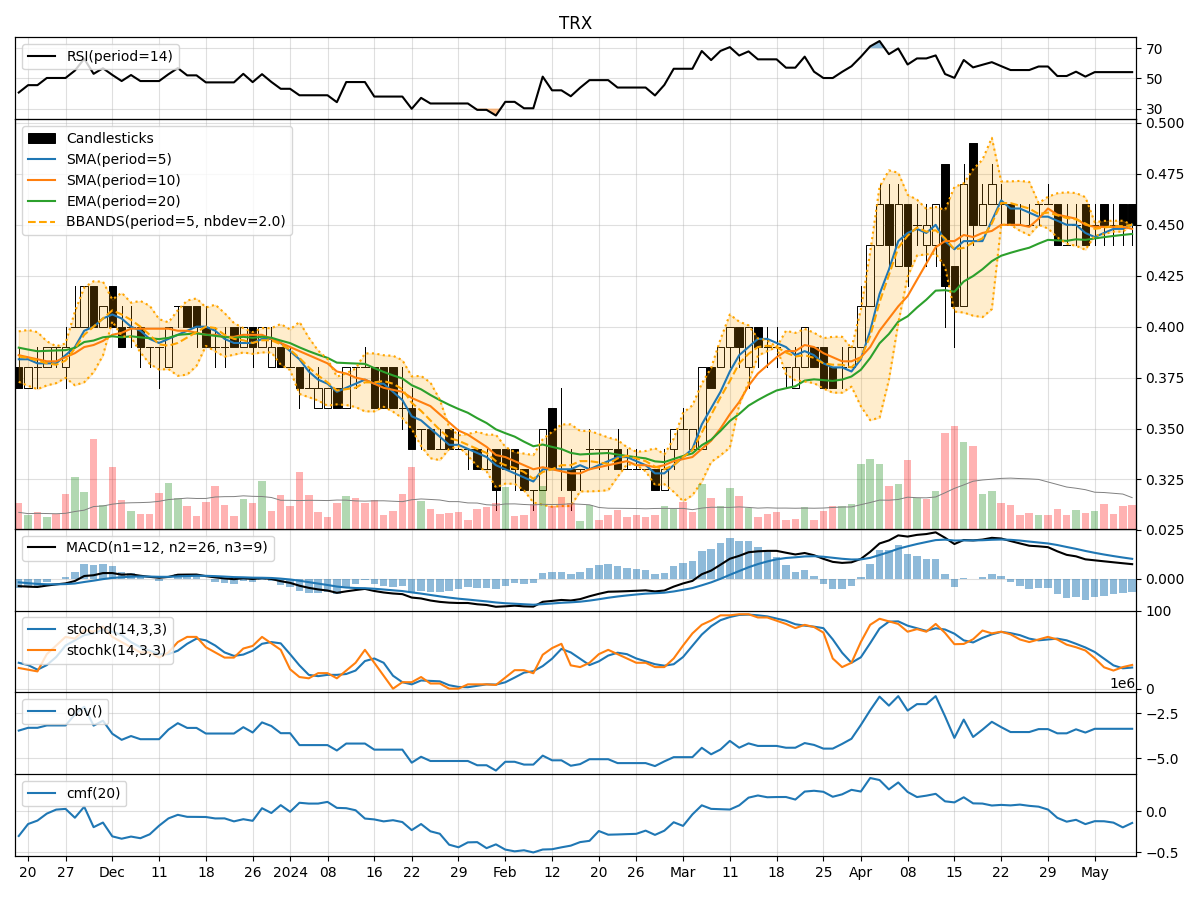
- Moving Averages (MA): The 5-day Moving Average (MA) has been fluctuating around the closing prices, indicating short-term price trends. The Simple Moving Average (SMA) and Exponential Moving Average (EMA) show a slight uptrend.
- MACD: The Moving Average Convergence Divergence (MACD) and its signal line have been positive, suggesting a bullish momentum.
Momentum Analysis:
- RSI: The Relative Strength Index (RSI) has been hovering around the neutral zone, indicating a balanced momentum.
- Stochastic Oscillator: The Stochastic indicators show a mix of overbought and oversold conditions, suggesting potential price reversals.
Volatility Analysis:
- Bollinger Bands (BB): The Bollinger Bands have been widening, indicating increased price volatility.
Volume Analysis:
- On-Balance Volume (OBV): The OBV has been relatively stable, suggesting a balance between buying and selling pressure.
- Chaikin Money Flow (CMF): The CMF has been positive, indicating buying pressure in the market.
Key Observations:
- The trend indicators suggest a mild uptrend in the short term.
- Momentum indicators show a neutral momentum with potential for price reversals.
- Volatility has increased, indicating potential price swings.
- Volume indicators reflect a balanced buying and selling pressure.
Conclusion:
Based on the analysis of the technical indicators, the stock price of TRX is likely to experience sideways movement in the coming days. The indicators point towards a consolidation phase with potential price reversals due to the mixed signals from momentum indicators. Traders should exercise caution and wait for clearer signals before making significant trading decisions.