Technical Analysis of BCAN 2024-05-31
Overview:
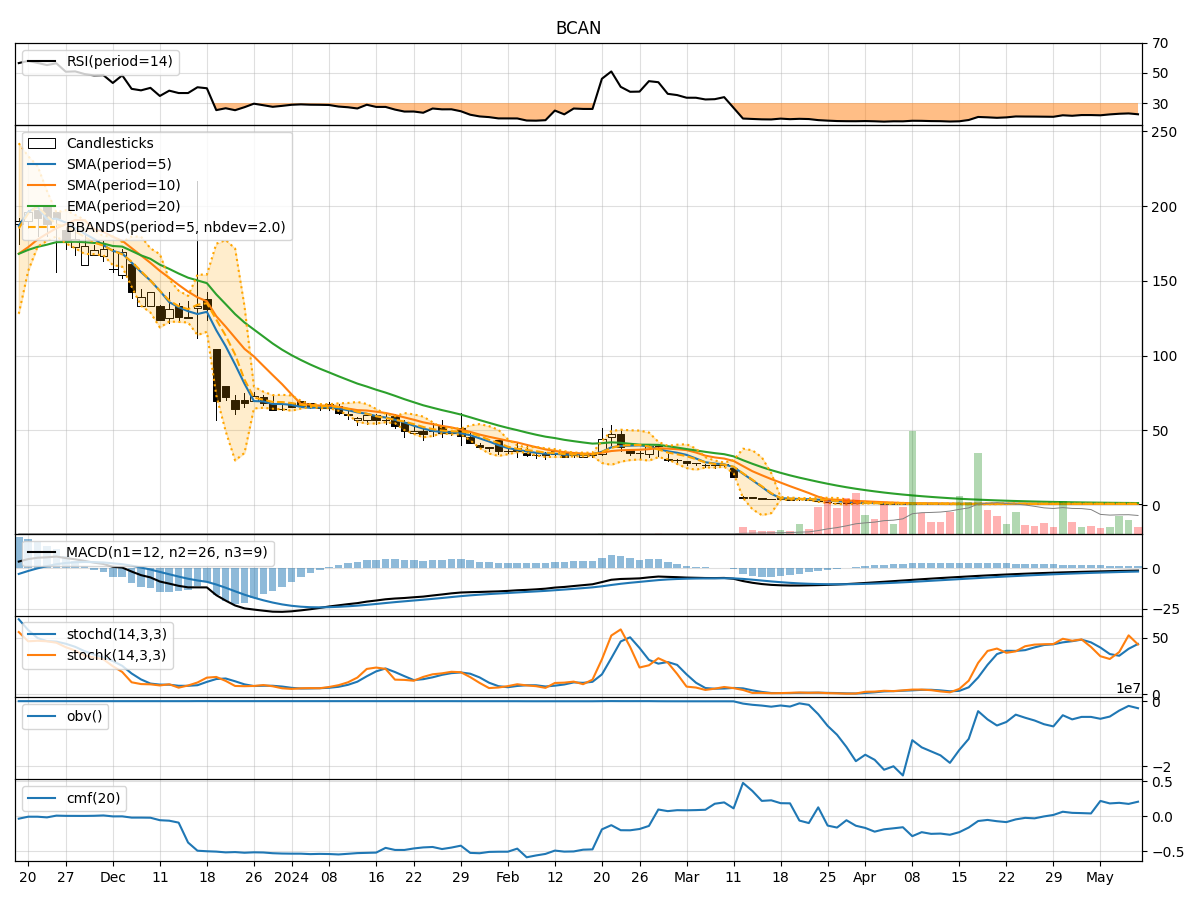
In analyzing the technical indicators for BCAN over the last 5 days, we will delve into the trend, momentum, volatility, and volume indicators to provide a comprehensive assessment of the stock's potential price movement. By examining these key factors, we aim to offer valuable insights and predictions for the next few days.
Trend Analysis:
- Moving Averages (MA): The 5-day MA has been consistently below the closing price, indicating a downward trend.
- MACD: The MACD line has been decreasing, with the MACD histogram also showing a downward trend.
- EMA: The EMA has been declining steadily over the past 5 days.
Key Observation: The trend indicators suggest a strong bearish sentiment in the stock's price movement.
Momentum Analysis:
- RSI: The RSI values have been relatively low, indicating oversold conditions.
- Stochastic Oscillator: Both %K and %D values are at very low levels, signaling potential oversold conditions.
- Williams %R: The Williams %R values are in the oversold territory.
Key Observation: The momentum indicators suggest that the stock is currently oversold.
Volatility Analysis:
- Bollinger Bands (BB): The stock price has been consistently below the lower Bollinger Band, indicating increased volatility and potential oversold conditions.
- Bollinger %B: The %B values have been below 0.2, indicating oversold conditions.
Key Observation: The volatility indicators suggest that the stock is experiencing high volatility and may be oversold.
Volume Analysis:
- On-Balance Volume (OBV): The OBV values have been decreasing, indicating selling pressure.
- Chaikin Money Flow (CMF): The CMF values have been negative, indicating a lack of buying pressure.
Key Observation: The volume indicators suggest that there is selling pressure in the stock.
Conclusion:
Based on the analysis of the trend, momentum, volatility, and volume indicators, the overall outlook for BCAN in the next few days is bearish. The stock is currently in an oversold state with high volatility and selling pressure. Therefore, it is likely that the stock price may continue to decline in the short term.
Recommendation: Considering the bearish signals from the technical indicators, it may be prudent to exercise caution or consider short-term trading strategies until there are signs of a reversal in the stock's price movement.