Technical Analysis of BHAT 2024-05-31
Overview:
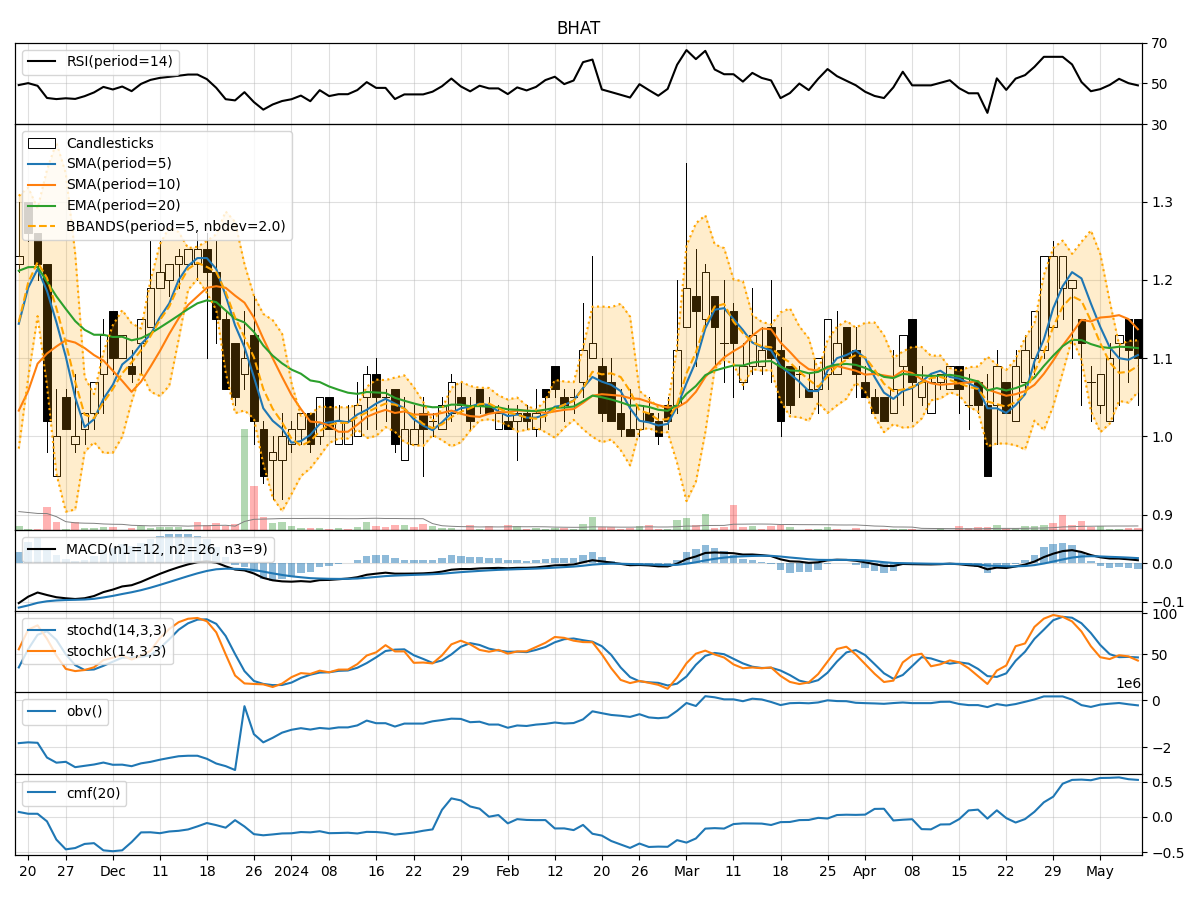
In the last 5 trading days, BHAT stock has shown mixed price movements with fluctuations in both price and volume. By analyzing various technical indicators such as trend, momentum, volatility, and volume, we can gain insights into the possible future price movements of BHAT stock.
Trend Analysis:
- Moving Averages (MA): The 5-day Moving Average (MA) has been fluctuating around the current price, indicating short-term price volatility.
- MACD: The MACD line has been consistently positive, suggesting a bullish trend in the short term.
- EMA: The Exponential Moving Average (EMA) has been trending upwards, indicating a potential bullish momentum.
Key Observation: The trend indicators suggest a short-term bullish sentiment in the stock.
Momentum Analysis:
- RSI: The Relative Strength Index (RSI) has been fluctuating around the neutral zone, indicating indecision in the market.
- Stochastic Oscillator: Both %K and %D have been fluctuating, showing mixed momentum signals.
- Williams %R: The Williams %R is hovering around oversold levels, indicating a potential buying opportunity.
Key Observation: Momentum indicators are mixed, suggesting a lack of clear direction in the stock's momentum.
Volatility Analysis:
- Bollinger Bands: The Bollinger Bands have widened, indicating increased volatility in the stock price.
- Bollinger %B: The %B indicator is fluctuating, suggesting potential price reversals.
- Average True Range (ATR): ATR has increased, indicating higher volatility in the stock.
Key Observation: Volatility indicators point towards increased price fluctuations and potential reversals in the stock.
Volume Analysis:
- On-Balance Volume (OBV): OBV has been fluctuating, indicating mixed buying and selling pressure.
- Chaikin Money Flow (CMF): CMF has been declining, suggesting a decrease in buying pressure.
Key Observation: Volume indicators show mixed signals with no clear trend in buying or selling pressure.
Conclusion:
Based on the analysis of technical indicators, the stock price of BHAT is likely to experience increased volatility in the coming days. The trend indicators suggest a short-term bullish sentiment, while momentum indicators show mixed signals. Volume indicators indicate indecisiveness in the market.
Recommendation:
Considering the mixed signals from the technical indicators, investors should exercise caution and closely monitor the stock's price movements. It is advisable to wait for clearer signals or confirmation of a strong trend before making any significant trading decisions.