Technical Analysis of CJJD 2024-05-31
Overview:
In analyzing the technical indicators for CJJD over the last 5 days, we will delve into the trend, momentum, volatility, and volume indicators to provide a comprehensive outlook on the possible stock price movement in the coming days. By examining these key aspects, we aim to offer valuable insights and predictions to guide investment decisions.
Trend Analysis:
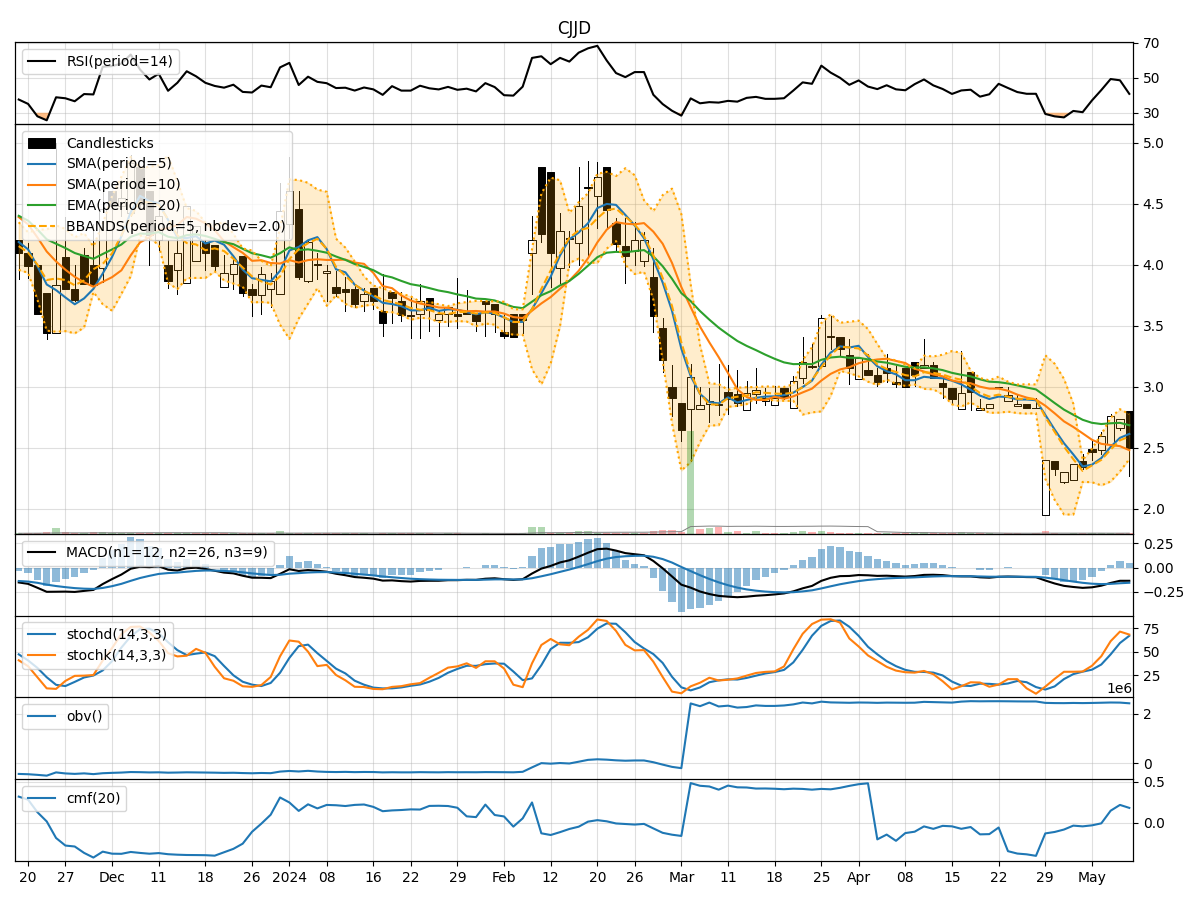
- Moving Averages (MA): The 5-day Moving Average (MA) has been fluctuating around the closing prices, indicating short-term price trends. The Simple Moving Average (SMA) and Exponential Moving Average (EMA) show a slight upward trend, suggesting potential bullish momentum.
- MACD: The MACD line has been positive, indicating a bullish trend. The MACD Histogram has been increasing, signaling strengthening bullish momentum.
Momentum Analysis:
- RSI: The Relative Strength Index (RSI) has been oscillating around the 50 level, indicating a neutral stance in momentum.
- Stochastic Oscillator: Both %K and %D have been declining, suggesting a potential shift towards oversold conditions.
- Williams %R: The Williams %R indicator has been moving towards oversold territory, indicating a possible buying opportunity.
Volatility Analysis:
- Bollinger Bands (BB): The Bollinger Bands have been narrowing, indicating decreasing volatility. The bands are currently close to the price, suggesting a potential breakout in either direction.
- Bollinger %B: The %B indicator has been fluctuating within a tight range, reflecting consolidation in price movement.
Volume Analysis:
- On-Balance Volume (OBV): The OBV indicator has been relatively stable, suggesting a balance between buying and selling pressure.
- Chaikin Money Flow (CMF): The CMF has been positive, indicating inflow of money into the stock.
Key Observations:
- The trend indicators suggest a potential bullish bias with the moving averages and MACD signaling upward momentum.
- Momentum indicators show a neutral to slightly bearish stance, with stochastic indicators hinting at oversold conditions.
- Volatility indicators point towards decreasing volatility and a potential breakout in price.
- Volume indicators indicate a balanced buying and selling pressure with positive money flow into the stock.
Conclusion:
Based on the analysis of the technical indicators, the next few days for CJJD could see sideways consolidation in price movement. While trend indicators suggest a bullish bias, momentum indicators indicate a neutral to slightly bearish stance. Volatility is decreasing, signaling a potential breakout, and volume indicators show a balance between buying and selling pressure. Therefore, it is recommended to exercise caution and closely monitor price action for potential entry or exit points.