Technical Analysis of ESLT 2024-05-31
Overview:
In analyzing the technical indicators for ESLT over the last 5 days, we will delve into the trend, momentum, volatility, and volume indicators to provide a comprehensive outlook on the possible stock price movement in the coming days. By examining these key aspects, we aim to offer valuable insights and recommendations for potential investors.
Trend Analysis:
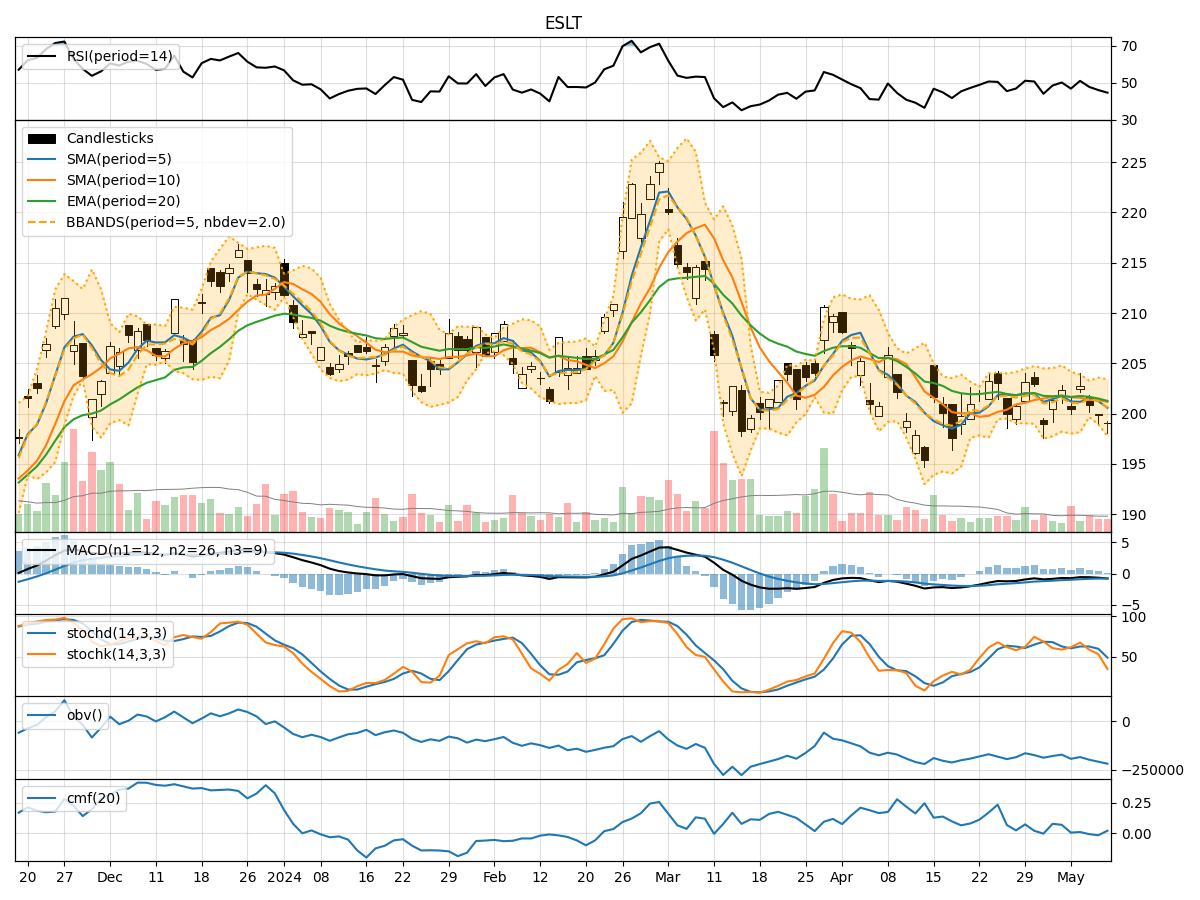
- Moving Averages (MA): The 5-day MA has been consistently below the closing price, indicating a short-term bearish trend.
- MACD: The MACD line has been decreasing, with the MACD line crossing below the signal line, suggesting a bearish momentum.
- EMA: The EMA has been declining, further supporting the bearish trend.
Momentum Analysis:
- RSI: The RSI has been hovering around the oversold territory, indicating a potential reversal or consolidation phase.
- Stochastic Oscillator: Both %K and %D have been decreasing, signaling a bearish momentum.
- Williams %R: The indicator has been in the oversold region, suggesting a possible reversal.
Volatility Analysis:
- Bollinger Bands (BB): The stock price has been trading within the lower Bollinger Band, indicating a potential oversold condition.
- Bollinger Band Width (BBW): The BBW has been narrowing, suggesting a decrease in volatility.
- Bollinger Band %B (BBP): The %B is below 0.2, indicating a potential oversold condition.
Volume Analysis:
- On-Balance Volume (OBV): The OBV has been declining, indicating selling pressure in the stock.
- Chaikin Money Flow (CMF): The CMF has been positive, suggesting some buying interest despite the overall bearish sentiment.
Conclusion:
Based on the analysis of the technical indicators, the stock of ESLT is currently in a bearish phase. The trend indicators, momentum oscillators, and volatility measures all point towards a downward movement in the stock price. However, there are signs of potential reversal or consolidation in the momentum indicators like RSI and Williams %R, indicating a possible short-term relief rally.
Recommendation:
Considering the overall bearish outlook, investors should exercise caution and wait for more definitive signals before considering any long positions. Short-term traders may find opportunities to capitalize on potential reversals, but the overall trend remains downward. It is advisable to closely monitor key support levels and wait for confirmation of a trend reversal before considering any significant investment in ESLT.