Technical Analysis of EUDA 2024-05-31
Overview:
In analyzing the technical indicators for EUDA stock over the last 5 days, we will delve into the trend, momentum, volatility, and volume indicators to provide a comprehensive outlook on the possible stock price movement in the coming days. By examining these key indicators, we aim to offer valuable insights and predictions for potential investors.
Trend Analysis:
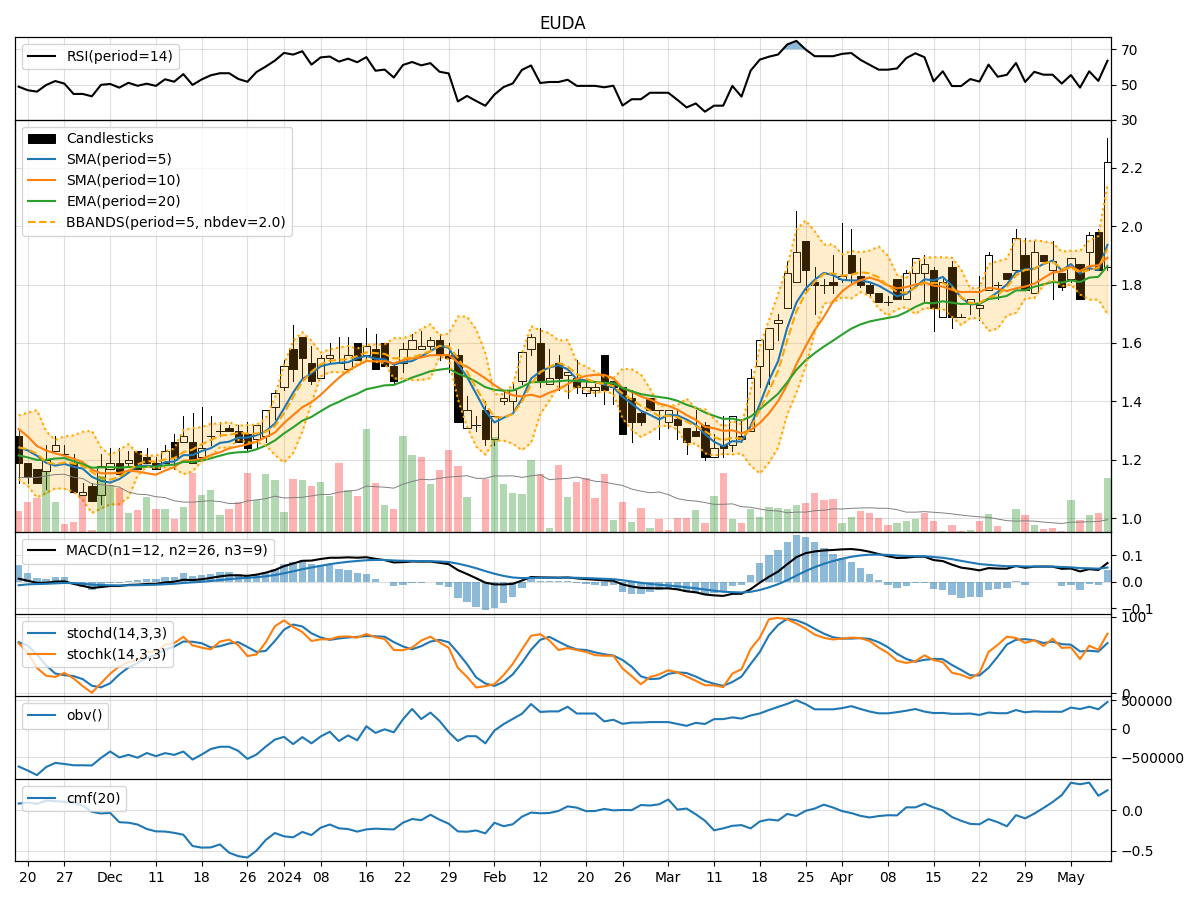
- Moving Averages (MA): The 5-day Moving Average (MA) has been fluctuating around the closing prices, indicating short-term price trends. The Simple Moving Average (SMA) and Exponential Moving Average (EMA) have been on an upward trajectory, suggesting a bullish sentiment.
- MACD: The Moving Average Convergence Divergence (MACD) has shown positive values, with the MACD line consistently above the signal line. This indicates a bullish trend in the stock price.
Momentum Analysis:
- RSI: The Relative Strength Index (RSI) has been fluctuating within the neutral to overbought range, suggesting a mixed sentiment among traders.
- Stochastic Oscillator: The Stochastic indicators have shown a decline in values, moving towards oversold territory, indicating a potential reversal in the stock price.
Volatility Analysis:
- Bollinger Bands (BB): The Bollinger Bands have shown narrowing bands, indicating decreasing volatility in the stock price. This could signal a period of consolidation or a potential breakout.
Volume Analysis:
- On-Balance Volume (OBV): The OBV has shown mixed movements, indicating indecision among investors regarding the stock.
- Chaikin Money Flow (CMF): The CMF has been positive, suggesting that money is flowing into the stock despite the mixed volume movements.
Key Observations:
- The trend indicators suggest a bullish sentiment in the short term, supported by the moving averages and MACD.
- Momentum indicators show a mixed sentiment, with RSI fluctuating and stochastic indicators hinting at a potential reversal.
- Volatility has been decreasing, indicating a period of consolidation or a potential breakout.
- Volume indicators show indecision among investors, with OBV and CMF providing conflicting signals.
Conclusion:
Based on the analysis of the technical indicators, the next few days' possible stock price movement for EUDA is likely to be sideways with a slight bullish bias. Traders should closely monitor the stochastic indicators for a potential reversal signal and watch for a breakout from the narrowing Bollinger Bands. It is essential to exercise caution and wait for confirmation from multiple indicators before making any trading decisions.