Technical Analysis of FRPT 2024-05-31
Overview:
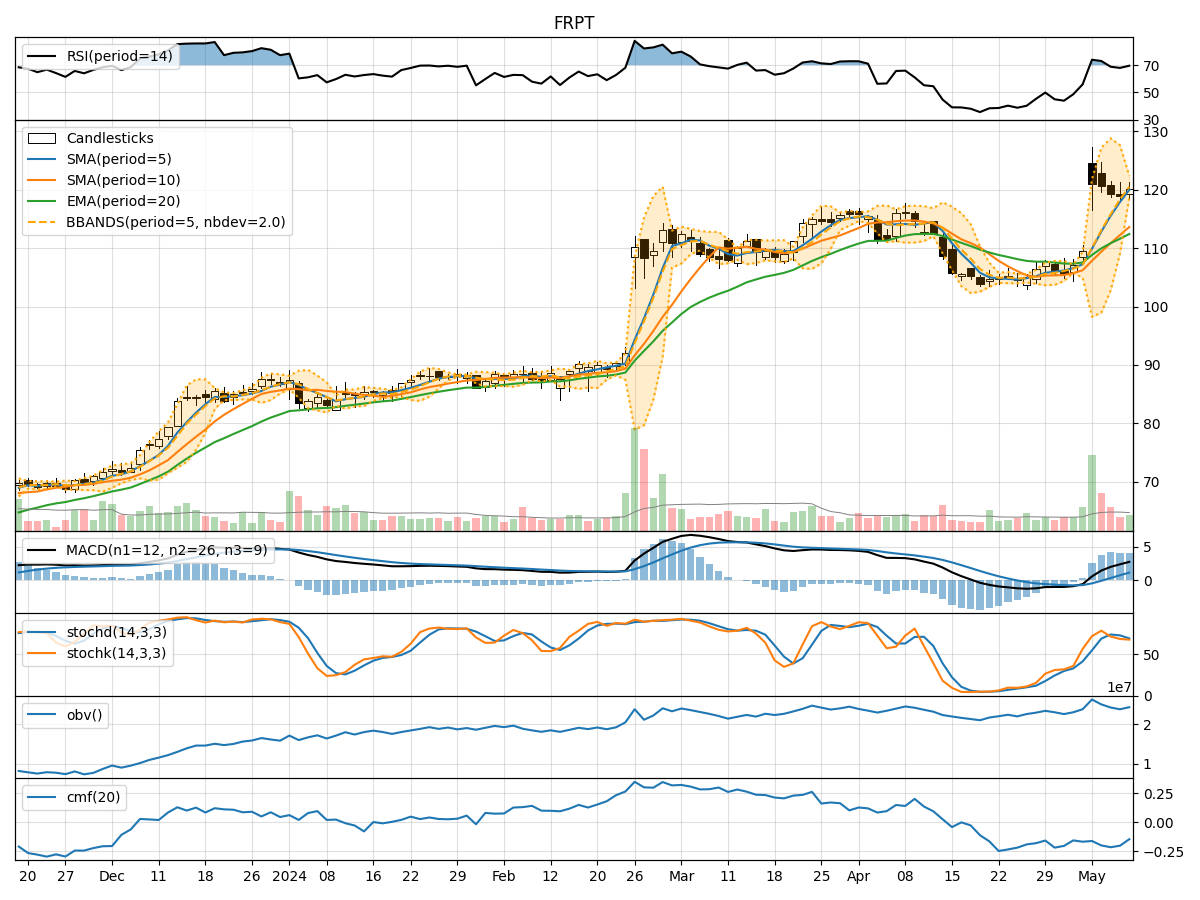
In analyzing the technical indicators for FRPT over the last 5 days, we will delve into the trend, momentum, volatility, and volume indicators to provide a comprehensive outlook on the possible stock price movement in the coming days. By examining key metrics such as moving averages, MACD, RSI, Bollinger Bands, and OBV, we aim to offer valuable insights and recommendations for potential trading strategies.
Trend Indicators:
- Moving Averages (MA): The 5-day moving average has been consistently trending above the longer-term SMAs and EMAs, indicating a bullish trend.
- MACD: The MACD line has been above the signal line, suggesting positive momentum in the stock price.
Momentum Indicators:
- RSI: The RSI has been fluctuating in the overbought territory, indicating strong buying pressure.
- Stochastic Oscillator: Both %K and %D have been relatively high, signaling potential overbought conditions.
Volatility Indicators:
- Bollinger Bands: The stock price has been trading within the bands, with the %B indicator showing fluctuations within the range.
Volume Indicators:
- On-Balance Volume (OBV): The OBV has been steadily increasing, reflecting strong buying interest.
- Chaikin Money Flow (CMF): The CMF has been positive, indicating money flow into the stock.
Key Observations:
- The trend indicators suggest a bullish sentiment with moving averages and MACD supporting upward momentum.
- Momentum indicators like RSI and Stochastic Oscillator point towards overbought conditions, potentially signaling a short-term correction.
- Volatility remains relatively stable within the Bollinger Bands, indicating a balanced market sentiment.
- Increasing OBV and positive CMF highlight strong buying pressure and positive money flow into the stock.
Conclusion:
Based on the analysis of the technical indicators, the next few days for FRPT are likely to see continued upward movement in the stock price. However, caution is advised as momentum indicators suggest potential overbought conditions, which could lead to a short-term pullback or consolidation. Traders should closely monitor key levels and consider taking profits or implementing risk management strategies to navigate potential market fluctuations. Overall, the outlook remains bullish with a possibility of short-term corrections.