Technical Analysis of FYBR 2024-05-31
Overview:
In analyzing the technical indicators for FYBR over the last 5 days, we will delve into the trends, momentum, volatility, and volume indicators to provide a comprehensive outlook on the possible stock price movement in the coming days. By examining these key factors, we aim to offer valuable insights and recommendations for potential investors.
Trend Analysis:
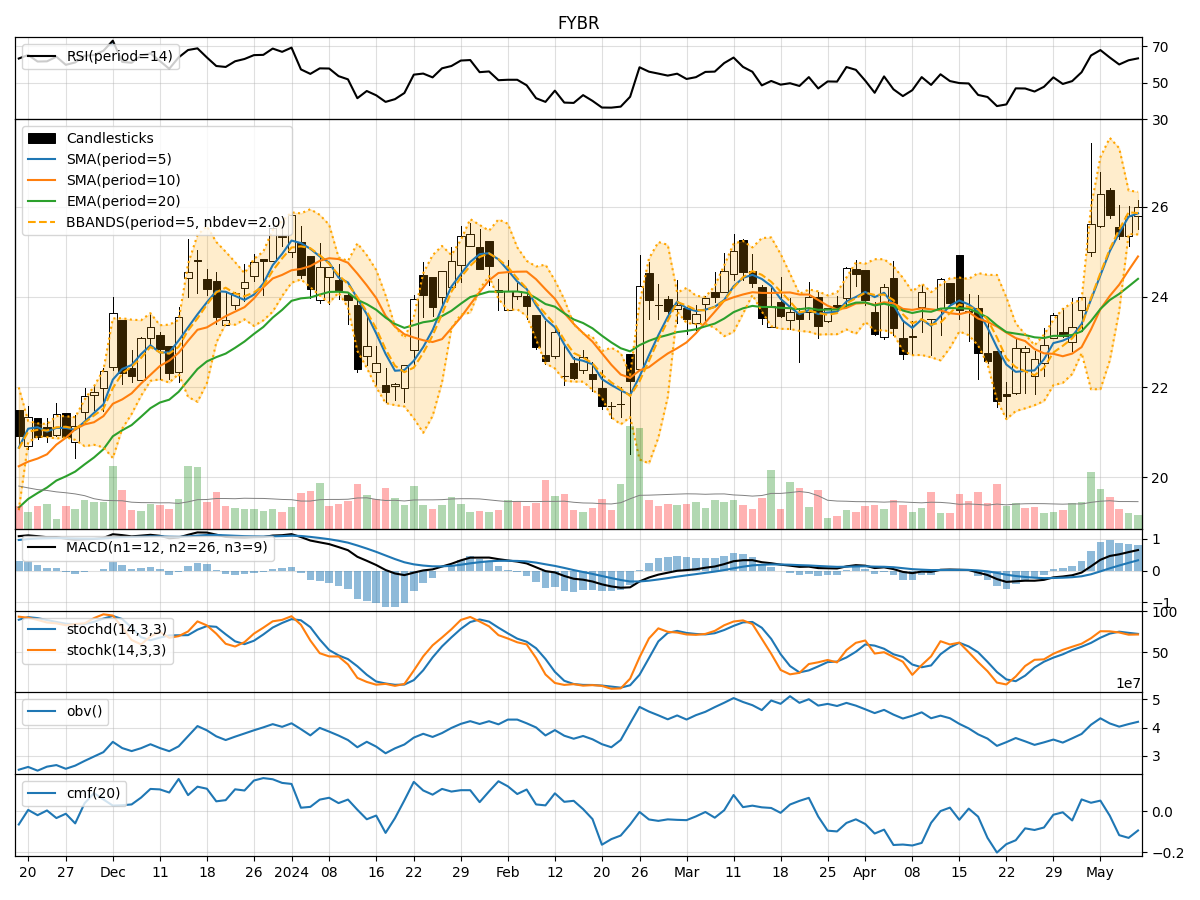
- Moving Averages (MA): The 5-day MA has been consistently below the closing prices, indicating a short-term downtrend.
- MACD: The MACD line has been positive but decreasing, while the MACD Histogram has been negative, suggesting a potential reversal in the trend.
- EMA: The EMA has been gradually increasing, reflecting a bullish sentiment in the longer term.
Momentum Analysis:
- RSI: The RSI has been fluctuating around the 50 level, indicating indecision in the market.
- Stochastic Oscillator: Both %K and %D have shown mixed signals, with %K crossing %D, suggesting a potential reversal.
- Williams %R: The indicator has been hovering in the oversold territory, signaling a possible buying opportunity.
Volatility Analysis:
- Bollinger Bands (BB): The stock price has been trading within the bands, indicating a period of consolidation.
- BB Width: The narrowing of the bands suggests decreasing volatility and a potential breakout in the near future.
Volume Analysis:
- On-Balance Volume (OBV): The OBV has shown mixed movements, reflecting uncertainty among investors.
- Chaikin Money Flow (CMF): The CMF has been negative, indicating selling pressure in the market.
Key Observations:
- The trend indicators suggest a mixed outlook, with short-term bearish signals and long-term bullish sentiment.
- Momentum indicators show indecision among traders, with potential for a reversal in the near future.
- Volatility is decreasing, indicating a period of consolidation, while volume indicators reflect uncertainty and selling pressure in the market.
Conclusion:
Based on the analysis of the technical indicators, the stock price of FYBR is likely to experience sideways movement in the next few days. The mixed signals from trend and momentum indicators, coupled with decreasing volatility and negative volume indicators, suggest a lack of clear direction in the market. Investors should exercise caution and closely monitor key levels for potential breakout or reversal signals before making any trading decisions.