Technical Analysis of GRWG 2024-05-31
Overview:
In analyzing the technical indicators for GRWG over the last 5 days, we will delve into the trend, momentum, volatility, and volume indicators to provide a comprehensive outlook on the possible stock price movement. By examining these key aspects, we aim to offer valuable insights and predictions for the upcoming days.
Trend Analysis:
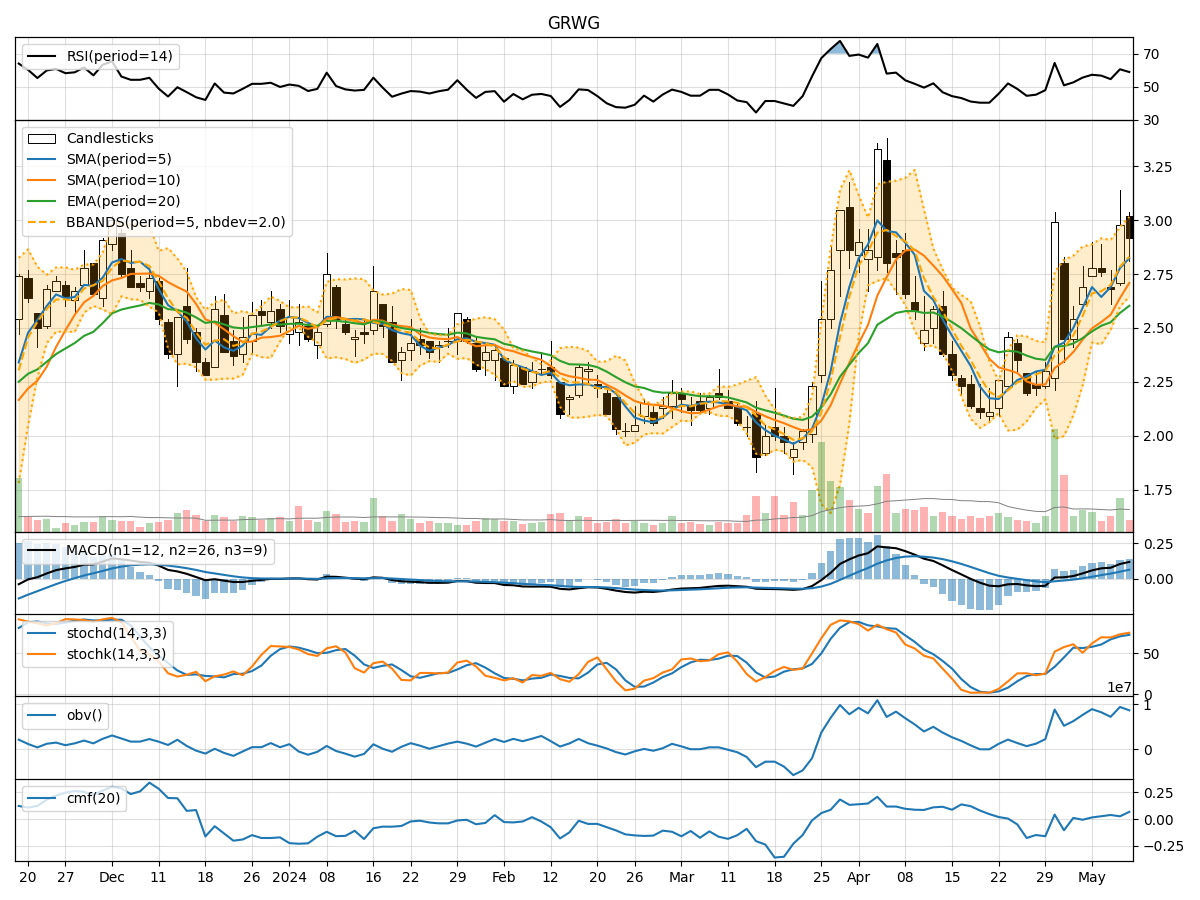
- Moving Averages (MA): The 5-day Moving Average (MA) has been fluctuating around the closing prices, indicating a lack of clear trend direction.
- MACD: The Moving Average Convergence Divergence (MACD) has been consistently negative, suggesting a bearish momentum in the short term.
- EMA: The Exponential Moving Average (EMA) has been declining, further supporting the bearish sentiment in the stock.
Momentum Analysis:
- RSI: The Relative Strength Index (RSI) has been hovering around the neutral zone, indicating a lack of strong momentum either bullish or bearish.
- Stochastic Oscillator: Both %K and %D have been relatively low, suggesting a potential oversold condition in the stock.
- Williams %R: The Williams %R is in the oversold territory, indicating a possible reversal or consolidation phase.
Volatility Analysis:
- Bollinger Bands: The Bollinger Bands have been narrowing, indicating decreasing volatility in the stock price.
- Bollinger %B: The %B indicator has been fluctuating around the midline, suggesting a lack of clear trend direction.
Volume Analysis:
- On-Balance Volume (OBV): The OBV has been fluctuating, indicating indecision among market participants regarding the stock.
- Chaikin Money Flow (CMF): The CMF has been negative, reflecting selling pressure in the stock.
Key Observations:
- The trend indicators suggest a bearish sentiment with declining moving averages and negative MACD.
- Momentum indicators show a lack of strong momentum, with oscillators indicating a potential oversold condition.
- Volatility indicators point towards decreasing volatility and a consolidation phase.
- Volume indicators reflect indecision and selling pressure in the stock.
Conclusion:
Based on the analysis of the technical indicators, the outlook for GRWG in the next few days is bearish. The stock is likely to experience further downside pressure, potentially entering a consolidation phase with decreased volatility. Traders should exercise caution and consider short-term selling strategies or wait for a clearer trend reversal signal before considering long positions.