Technical Analysis of IBRX 2024-05-10
Overview:
In analyzing the technical indicators for IBRX over the last 5 days, we will delve into the trend, momentum, volatility, and volume indicators to provide a comprehensive outlook on the possible stock price movement in the coming days. By examining these key aspects, we aim to offer valuable insights and predictions to guide your investment decisions.
Trend Indicators:
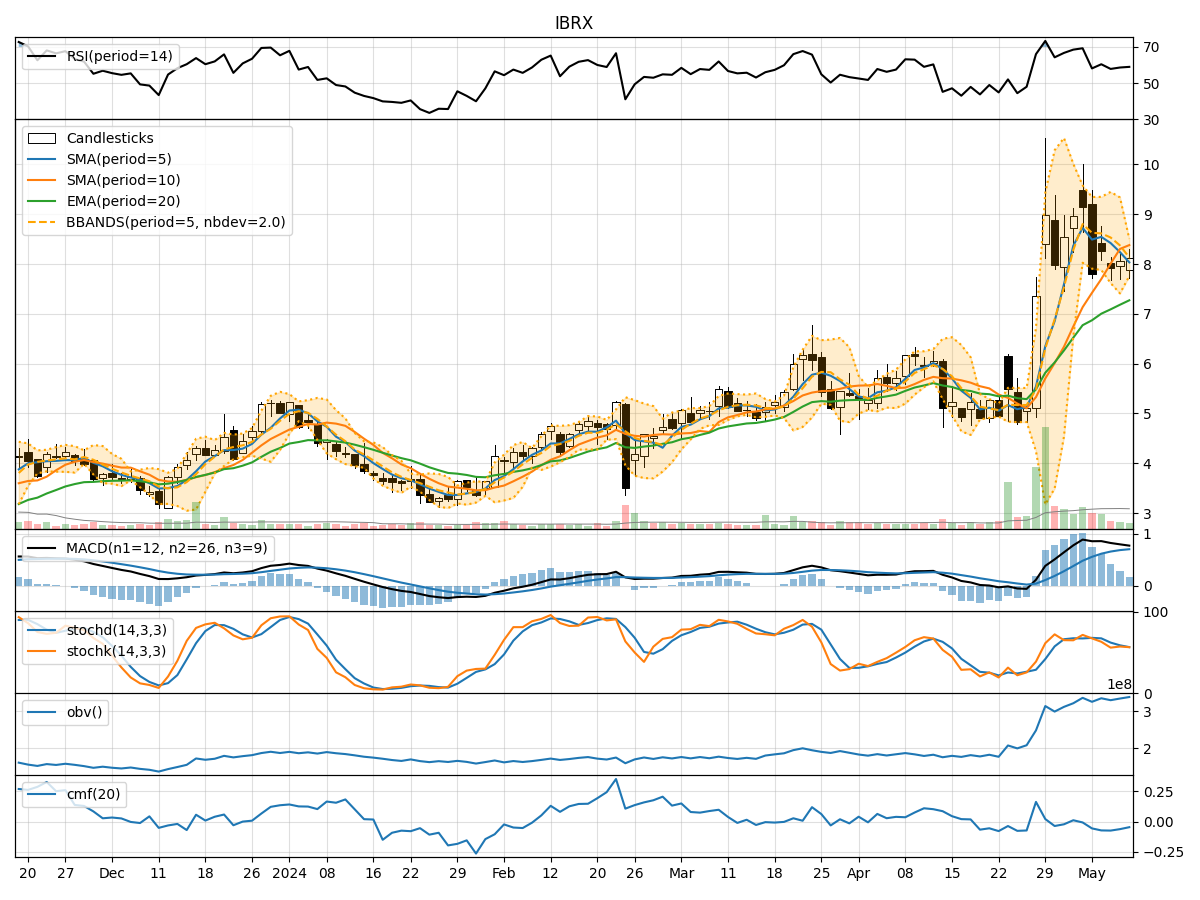
- Moving Averages (MA): The 5-day moving average has been consistently below the closing prices, indicating a short-term downtrend.
- MACD: The MACD line has been decreasing, but the MACD histogram is showing signs of convergence, suggesting a potential reversal in the downtrend.
- EMA: The exponential moving average has been gradually increasing, indicating a possible shift towards a bullish trend.
Momentum Indicators:
- RSI: The Relative Strength Index has been hovering around the neutral zone, suggesting a lack of strong momentum in either direction.
- Stochastic Oscillator: Both %K and %D have been declining, indicating a weakening momentum.
- Williams %R: The indicator is in the oversold territory, signaling a potential buying opportunity.
Volatility Indicators:
- Bollinger Bands: The bands have been narrowing, indicating decreasing volatility and a possible period of consolidation.
- Bollinger %B: The %B indicator is approaching the lower band, suggesting a potential bounce back in prices.
- Average True Range (ATR): ATR has been decreasing, reflecting reduced price volatility.
Volume Indicators:
- On-Balance Volume (OBV): The OBV has been relatively stable, indicating a balance between buying and selling pressure.
- Chaikin Money Flow (CMF): The CMF has been negative, suggesting outflow of money from the stock.
Key Observations and Opinions:
- Trend: The trend indicators show a mixed picture, with a potential reversal in the MACD and EMA signaling a shift towards a bullish sentiment.
- Momentum: Momentum indicators suggest a lack of strong momentum, with the Williams %R indicating a possible buying opportunity.
- Volatility: Volatility indicators point towards a period of consolidation, with decreasing Bollinger Bands and ATR.
- Volume: Volume indicators reflect a balanced buying and selling pressure, with the CMF showing a negative trend.
Conclusion:
Based on the analysis of the technical indicators, the stock price of IBRX is likely to experience sideways movement in the coming days. The mixed signals from trend and momentum indicators, coupled with decreasing volatility and balanced volume, indicate a period of consolidation. Traders may consider waiting for clearer signals before making significant trading decisions.