Technical Analysis of ICLK 2024-05-31
Overview:
In analyzing the technical indicators for ICLK over the last 5 days, we will delve into the trend, momentum, volatility, and volume indicators to provide a comprehensive outlook on the possible stock price movement. By examining these key aspects, we aim to offer valuable insights and predictions for the upcoming days.
Trend Analysis:
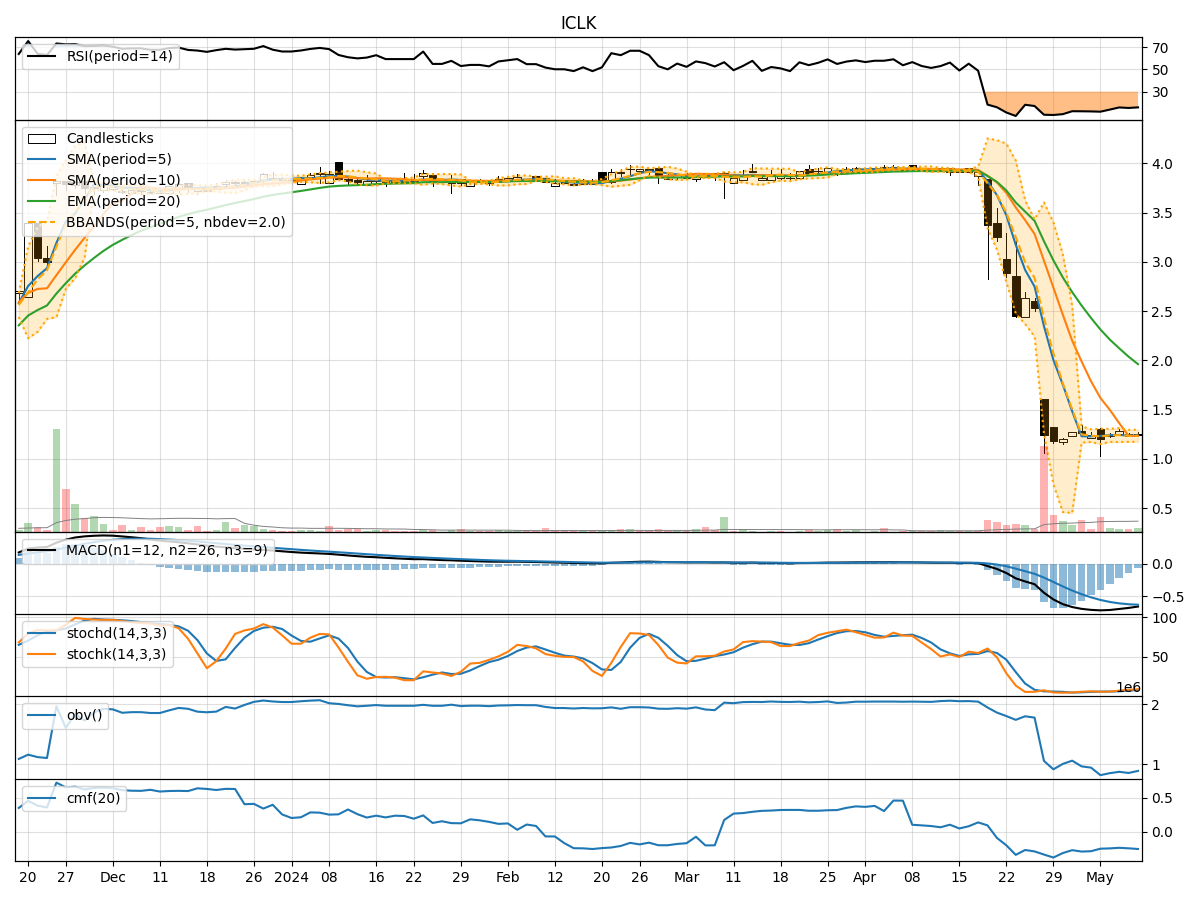
- Moving Averages (MA): The 5-day Moving Average (MA) has been relatively stable around 1.26-1.27, indicating a neutral trend.
- MACD and Signal Line: The MACD line has been consistently negative, suggesting a bearish trend, although the gap between the MACD and Signal Line has been narrowing.
- EMA: The Exponential Moving Average (EMA) has been declining, reflecting a bearish sentiment in the short to medium term.
Momentum Analysis:
- RSI: The Relative Strength Index (RSI) has been hovering around 20-22, indicating oversold conditions.
- Stochastic Oscillator: Both %K and %D have been fluctuating in the mid-range, suggesting indecision in the market.
- Williams %R: The Williams %R is around -30 to -50, indicating potential buying opportunities.
Volatility Analysis:
- Bollinger Bands (BB): The Bollinger Bands have been narrowing, indicating decreasing volatility and a potential price breakout.
- BB %B: The %B indicator has been fluctuating around 0.5-0.9, reflecting uncertainty in price direction.
Volume Analysis:
- On-Balance Volume (OBV): The OBV has shown a slight decrease, suggesting some distribution of shares.
- Chaikin Money Flow (CMF): The CMF has been negative, indicating selling pressure in the market.
Key Observations:
- The stock is currently in a consolidation phase with no clear trend direction.
- Momentum indicators suggest oversold conditions, potentially signaling a reversal.
- Volatility is decreasing, indicating a possible period of price stability.
- Volume indicators show some distribution of shares but no significant selling pressure.
Conclusion:
Based on the analysis of the technical indicators, the next few days for ICLK are likely to see sideways movement with a potential for a bullish reversal. Traders should closely monitor key levels such as the 5-day MA and watch for a breakout from the tightening Bollinger Bands. While the stock may experience some volatility, the overall sentiment points towards a possible upward movement in the near term. It is advisable to wait for confirmation from key indicators before making any trading decisions.