Technical Analysis of ICLR 2024-05-31
Overview:
In analyzing the technical indicators for ICLR over the last 5 days, we will delve into the trend, momentum, volatility, and volume indicators to provide a comprehensive outlook on the possible stock price movement. By examining these key aspects, we aim to offer valuable insights and predictions for the upcoming days.
Trend Analysis:
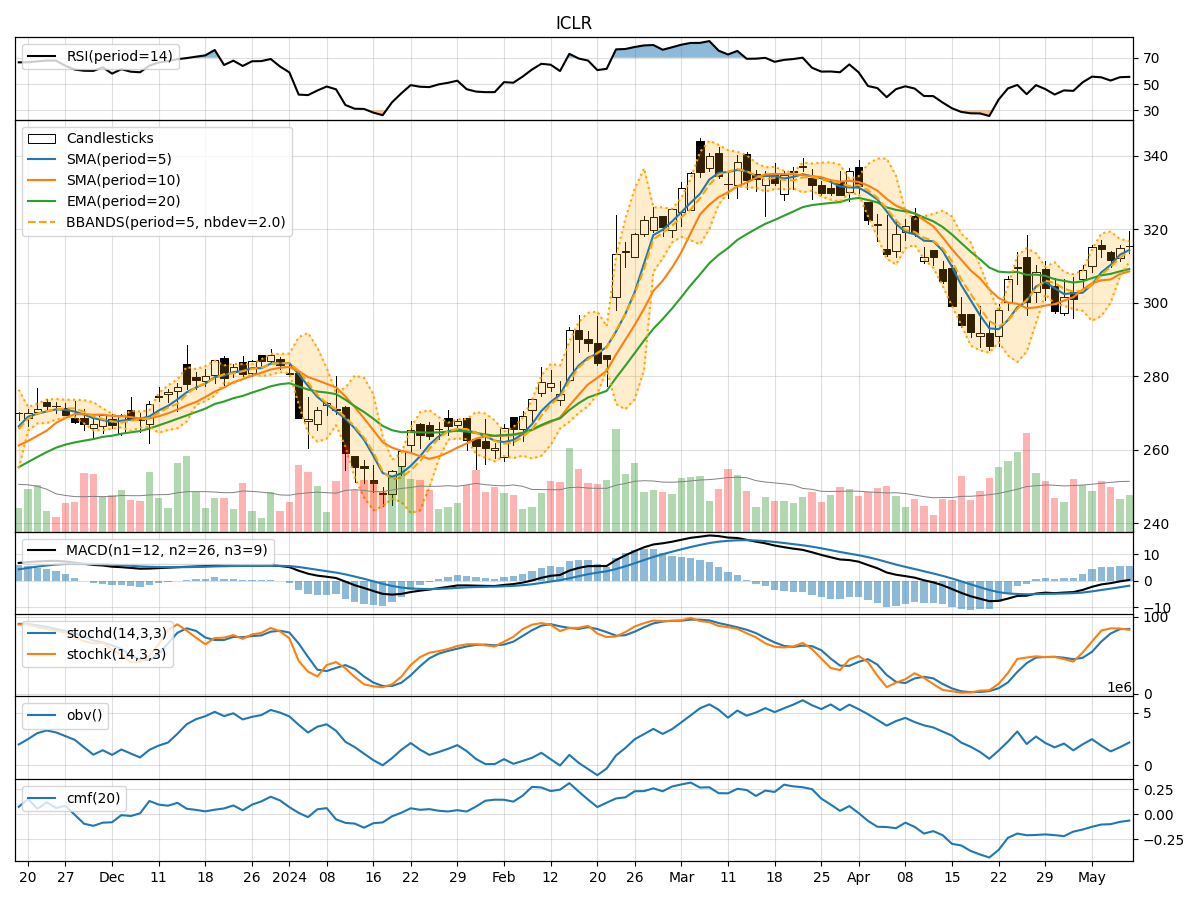
- Moving Averages (MA): The 5-day Moving Average (MA) has been consistently above the Simple Moving Average (SMA) and Exponential Moving Average (EMA), indicating a bullish trend.
- MACD: The MACD line has been consistently above the signal line, with the MACD Histogram showing an increasing trend, suggesting bullish momentum.
Momentum Analysis:
- RSI: The Relative Strength Index (RSI) has been fluctuating but generally staying within the neutral range, indicating a lack of strong momentum.
- Stochastic Oscillator: Both %K and %D have been declining, suggesting a potential bearish momentum.
- Williams %R: The Williams %R is in oversold territory, indicating a possible reversal in momentum.
Volatility Analysis:
- Bollinger Bands (BB): The stock price has been trading within the Bollinger Bands, with the bands widening, indicating increased volatility.
- Bollinger %B: The %B indicator is relatively low, suggesting a potential buying opportunity as the stock may be oversold.
Volume Analysis:
- On-Balance Volume (OBV): The OBV has been increasing, indicating accumulation by investors.
- Chaikin Money Flow (CMF): The CMF has been positive, suggesting buying pressure in the market.
Key Observations:
- The trend indicators suggest a bullish sentiment in the short term.
- Momentum indicators show mixed signals, with a slight bearish bias.
- Volatility has increased, potentially leading to larger price swings.
- Volume indicators point towards accumulation and positive buying pressure.
Conclusion:
Based on the analysis of the technical indicators, the next few days' possible stock price movement for ICLR is likely to be bullish in the short term. However, given the mixed signals from momentum indicators and the increased volatility, there might be some consolidation or sideways movement before a potential continuation of the bullish trend. Investors should closely monitor key support and resistance levels for confirmation of the upward trend.