Technical Analysis of ICUI 2024-05-31
Overview:
In analyzing the technical indicators for ICUI over the last 5 days, we will delve into the trend, momentum, volatility, and volume indicators to provide a comprehensive outlook on the possible stock price movement in the coming days. By examining these key indicators, we aim to offer valuable insights and predictions for informed decision-making.
Trend Indicators:
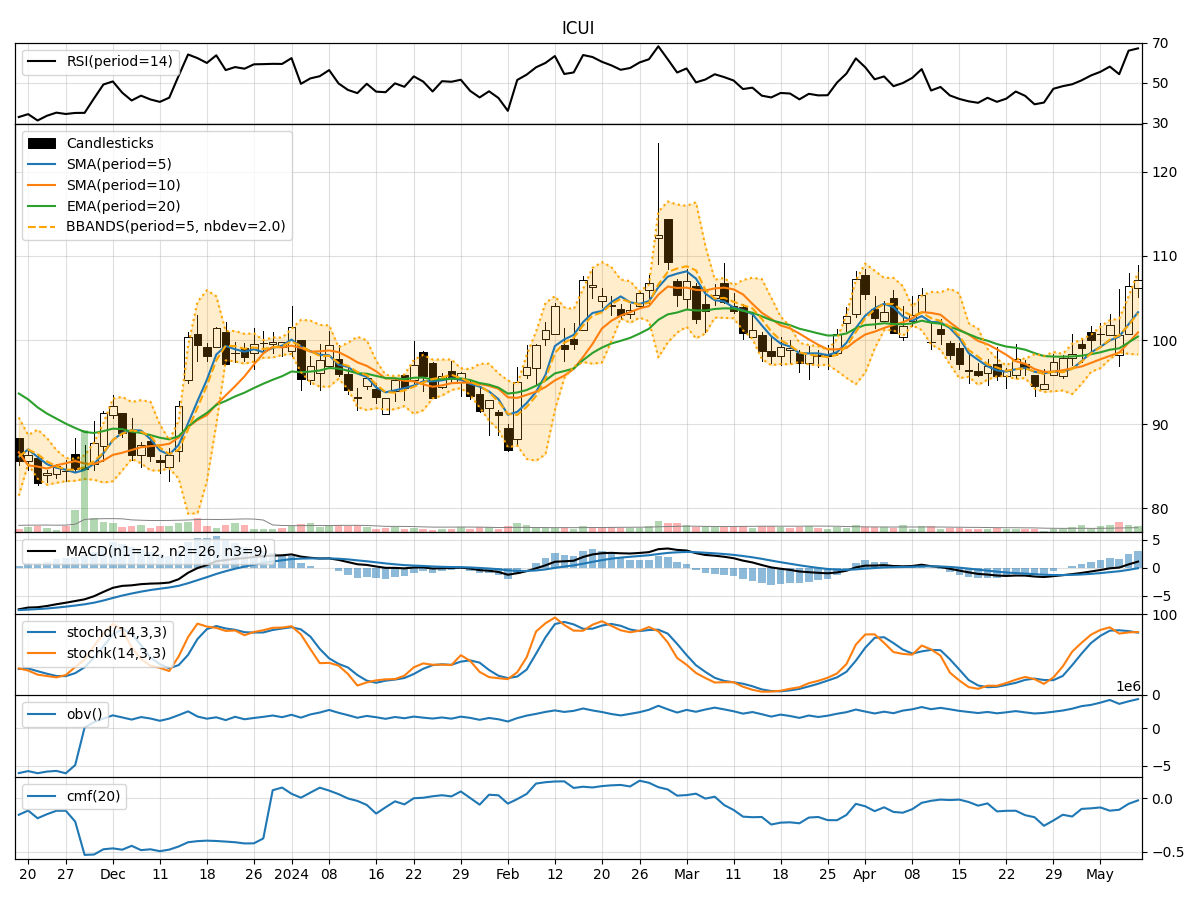
- Moving Averages (MA): The 5-day MA has been fluctuating around the 103 level, indicating a relatively stable trend in the short term.
- MACD: The MACD line has been consistently below the signal line, suggesting a bearish momentum in the stock price.
- EMA: The EMA has been gradually declining, reflecting a downward trend in the stock price.
Key Observation: The trend indicators point towards a bearish sentiment in the stock price movement.
Momentum Indicators:
- RSI: The RSI has been oscillating around the mid-level, indicating a neutral momentum in the stock.
- Stochastic Oscillator: Both %K and %D have been trending downwards, signaling a weakening momentum.
- Williams %R: The indicator has been in oversold territory, suggesting a potential reversal in the stock price.
Key Observation: The momentum indicators reflect a neutral to slightly bearish sentiment in the stock price movement.
Volatility Indicators:
- Bollinger Bands: The bands have been narrowing, indicating decreasing volatility in the stock price.
- Bollinger %B: The %B has been hovering around the mid-level, suggesting a balanced market sentiment.
Key Observation: Volatility indicators point towards a consolidation phase in the stock price movement.
Volume Indicators:
- On-Balance Volume (OBV): The OBV has shown mixed signals with fluctuations in volume, reflecting indecision among market participants.
- Chaikin Money Flow (CMF): The CMF has been negative, indicating selling pressure in the stock.
Key Observation: Volume indicators suggest a mixed sentiment in the stock price movement.
Conclusion:
Based on the analysis of trend, momentum, volatility, and volume indicators, the overall outlook for ICUI in the next few days leans towards a bearish bias. The trend indicators indicate a downward trajectory, while momentum indicators show a neutral to slightly bearish sentiment. Volatility indicators suggest a consolidation phase, and volume indicators reflect mixed signals.
Recommendation:
Considering the bearish trend and momentum, investors may consider caution in their trading decisions. It is advisable to closely monitor key support levels and wait for confirmation of a potential reversal before considering long positions. Additionally, keeping an eye on any significant news or market developments that could impact the stock price is crucial.
Disclaimer:
This analysis is based solely on technical indicators and historical data, and it is essential to conduct thorough research and consider other fundamental factors before making any investment decisions. Market dynamics can change rapidly, so staying informed and adapting to new information is key in navigating the stock market successfully.