Technical Analysis of INSE 2024-05-31
Overview:
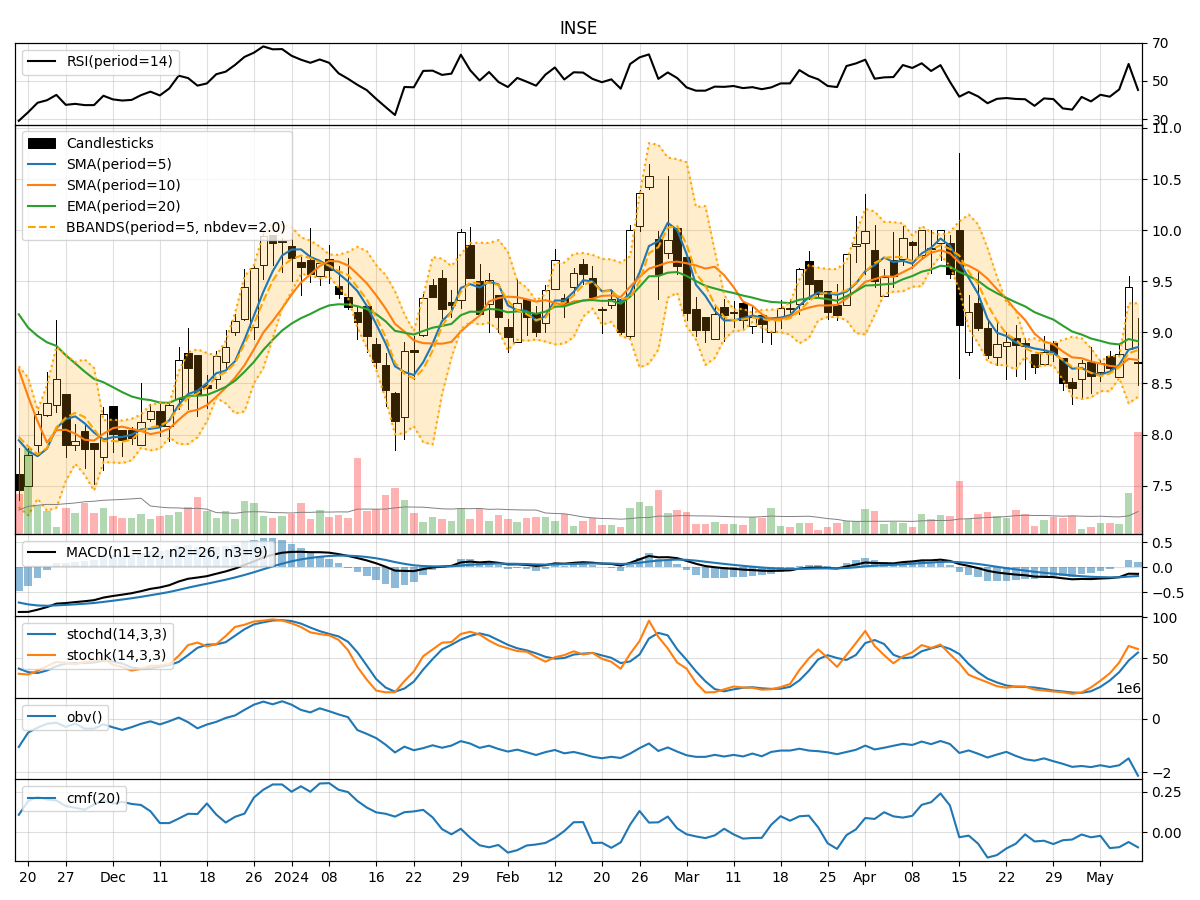
In analyzing the technical indicators for INSE over the last 5 days, we will delve into the trend, momentum, volatility, and volume indicators to provide a comprehensive outlook on the possible stock price movement in the coming days.
Trend Analysis:
- Moving Averages (MA): The 5-day Moving Average (MA) has been consistently above the Simple Moving Average (SMA) and Exponential Moving Average (EMA), indicating a bullish trend.
- MACD: The MACD line has been consistently above the signal line, with the MACD Histogram showing an increasing positive trend, further supporting a bullish sentiment.
Momentum Analysis:
- RSI: The Relative Strength Index (RSI) has been fluctuating around the 50 level, indicating a neutral momentum.
- Stochastic Oscillator: Both %K and %D have been in the overbought zone, suggesting a potential reversal or consolidation.
Volatility Analysis:
- Bollinger Bands (BB): The stock price has been trading within the Bollinger Bands, with the bands narrowing, indicating decreasing volatility.
- Bollinger %B: The %B indicator has been fluctuating within the bands, suggesting a lack of clear direction in price movement.
Volume Analysis:
- On-Balance Volume (OBV): The OBV has been showing a slight decrease, indicating some distribution happening in the stock.
- Chaikin Money Flow (CMF): The CMF has been positive but trending downwards, signaling potential selling pressure.
Conclusion:
Based on the analysis of the technical indicators, the stock of INSE is currently in a consolidation phase with neutral momentum and decreasing volatility. The trend remains bullish based on moving averages and MACD, but the overbought Stochastic Oscillator and decreasing OBV suggest a possible short-term correction or sideways movement in the stock price.
Recommendation:
- Short-term Traders: Consider taking profits or setting tight stop-loss orders due to the overbought Stochastic Oscillator.
- Long-term Investors: Monitor the stock closely for a potential entry point during a correction or consolidation phase.
Disclaimer:
Remember that technical analysis is not a guaranteed predictor of future price movements, and other fundamental factors can influence stock prices. It is essential to conduct thorough research and consider multiple indicators before making any investment decisions. Consulting with a financial advisor is recommended for personalized advice tailored to your investment goals and risk tolerance.