Technical Analysis of LAMR 2024-05-31
Overview:
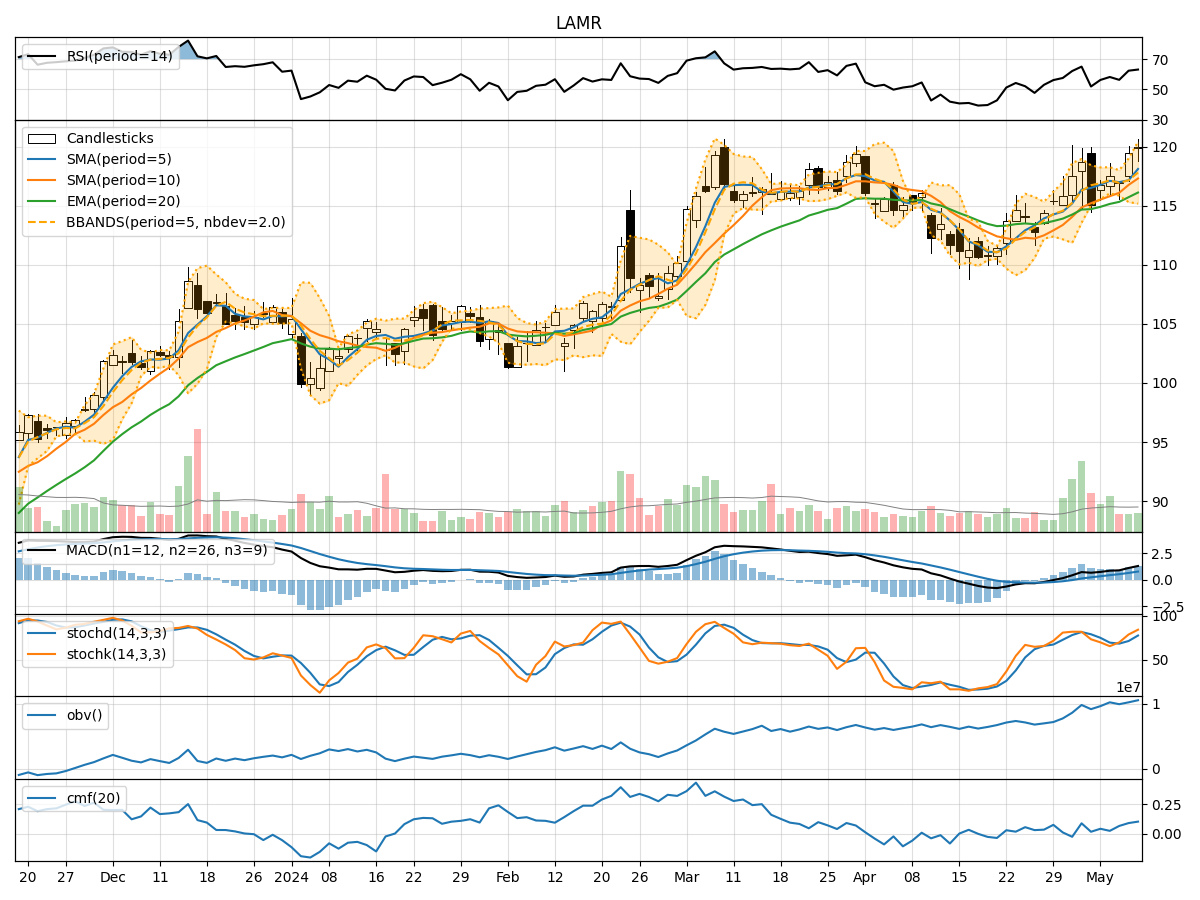
In analyzing the technical indicators for LAMR over the last 5 days, we will delve into the trends, momentum, volatility, and volume indicators to provide a comprehensive outlook on the possible stock price movement in the coming days.
Trend Indicators:
- Moving Averages (MA): The 5-day MA has been consistently below the closing price, indicating a short-term bearish trend.
- MACD: The MACD line has been below the signal line, suggesting a bearish momentum.
- EMA: The EMA has been declining, reflecting a bearish sentiment in the stock.
Momentum Indicators:
- RSI: The RSI has been fluctuating around the 50 level, indicating a lack of strong momentum in either direction.
- Stochastic Oscillator: Both %K and %D have been trending lower, signaling a bearish momentum.
- Williams %R: The indicator has been in oversold territory, suggesting a potential reversal in the short term.
Volatility Indicators:
- Bollinger Bands: The stock price has been trading within the lower Bollinger Band, indicating oversold conditions.
- Bollinger %B: The %B indicator is below 0.2, suggesting a potential bounce back in price.
- Average True Range (ATR): The ATR has been relatively stable, indicating low volatility in the stock.
Volume Indicators:
- On-Balance Volume (OBV): The OBV has been fluctuating, indicating indecision among investors.
- Chaikin Money Flow (CMF): The CMF has been positive but trending lower, signaling potential selling pressure.
Key Observations:
- The stock is currently in a short-term bearish trend based on moving averages and MACD.
- Momentum indicators suggest a lack of strong buying interest.
- Volatility indicators point towards oversold conditions, potentially signaling a reversal.
- Volume indicators show mixed signals with indecision among investors.
Conclusion:
Based on the analysis of the technical indicators, the stock is likely to experience a short-term consolidation phase with a potential for a bullish reversal in the coming days. Traders should closely monitor key support and resistance levels for potential entry or exit points. It is advisable to wait for confirmation from price action before making any significant trading decisions.