Technical Analysis of LCFY 2024-05-31
Overview:
In analyzing the technical indicators for LCFY over the last 5 days, we will delve into the trend, momentum, volatility, and volume indicators to provide a comprehensive outlook on the possible stock price movement in the coming days. By examining these key aspects, we aim to offer valuable insights and recommendations for potential investors.
Trend Analysis:
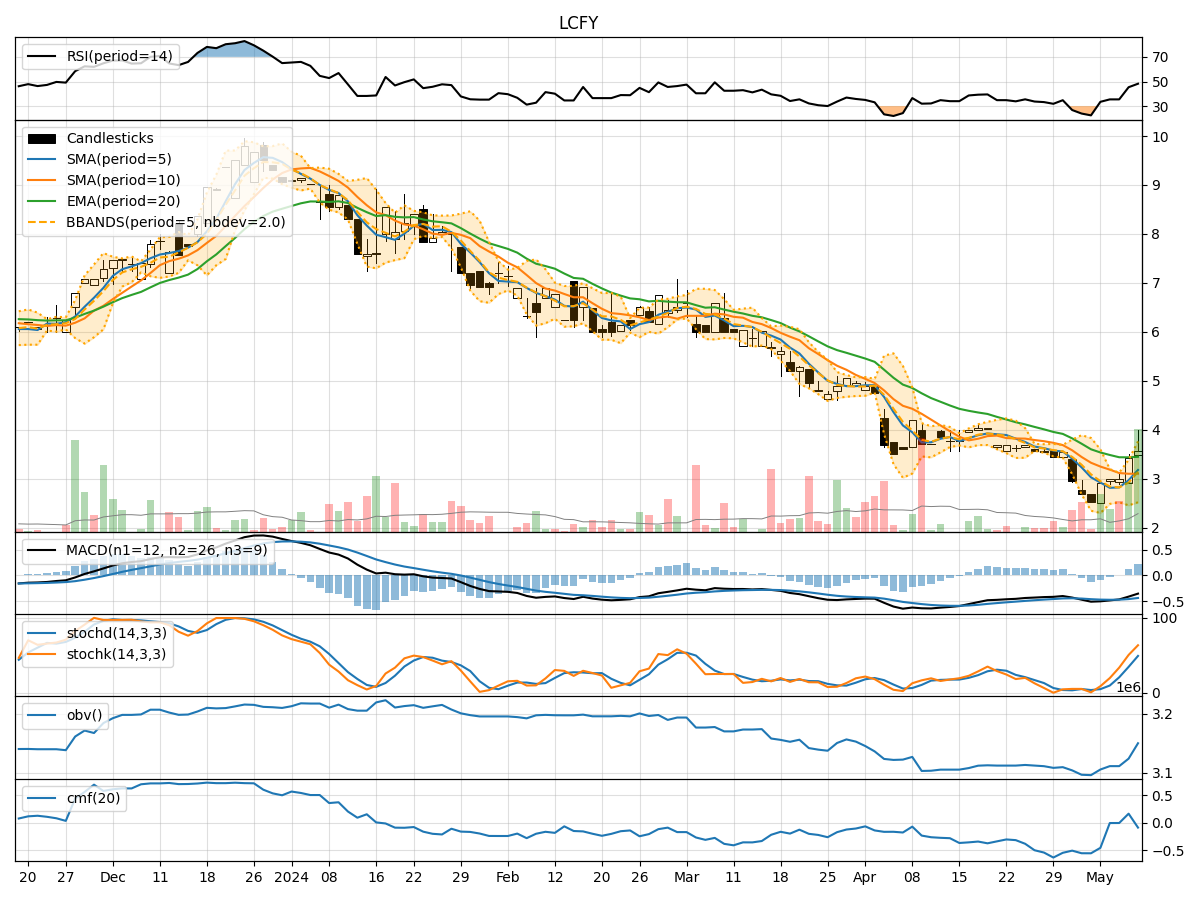
- Moving Averages (MA): The 5-day MA has been consistently below the closing prices, indicating a short-term downtrend.
- MACD: The MACD line has been negative, suggesting a bearish momentum in the stock.
- EMA: The EMA has been declining, reflecting a weakening trend in the stock price.
Key Observation: The trend indicators point towards a bearish sentiment in the stock price movement.
Momentum Analysis:
- RSI: The RSI values have been fluctuating around the oversold region, indicating a lack of strong momentum.
- Stochastic Oscillator: Both %K and %D have been relatively low, signaling a potential lack of buying pressure.
- Williams %R: The indicator has been hovering in the oversold territory, suggesting a possible reversal.
Key Observation: Momentum indicators reflect a neutral to slightly bearish momentum in the stock.
Volatility Analysis:
- Bollinger Bands (BB): The bands have been narrowing, indicating decreasing volatility in the stock price.
- Bollinger %B: The %B values have been fluctuating within a tight range, suggesting a period of consolidation.
Key Observation: Volatility indicators suggest a consolidation phase in the stock price.
Volume Analysis:
- On-Balance Volume (OBV): The OBV values have been negative, indicating a net selling pressure in the stock.
- Chaikin Money Flow (CMF): The CMF values have been consistently negative, reflecting a lack of buying interest.
Key Observation: Volume indicators point towards a bearish sentiment in the stock.
Conclusion:
Based on the analysis of the trend, momentum, volatility, and volume indicators, the overall outlook for LCFY in the next few days is bearish. The stock is likely to experience continued downward pressure, with a potential for further decline in the stock price. Investors should exercise caution and consider waiting for more positive signals before considering any long positions.
Key Conclusion:
- Overall Sentiment: Bearish
- Expected Price Movement: Downward
- Recommendation: Exercise Caution and Wait for Positive Signals
By carefully considering these technical indicators and their implications, investors can make more informed decisions regarding their positions in LCFY.