Technical Analysis of NLSP 2024-05-31
Overview:
In analyzing the technical indicators for NLSP stock over the last 5 days, we will delve into the trend, momentum, volatility, and volume indicators to provide a comprehensive outlook on the possible stock price movement in the coming days. By examining these key indicators, we aim to offer valuable insights and predictions for potential investors.
Trend Analysis:
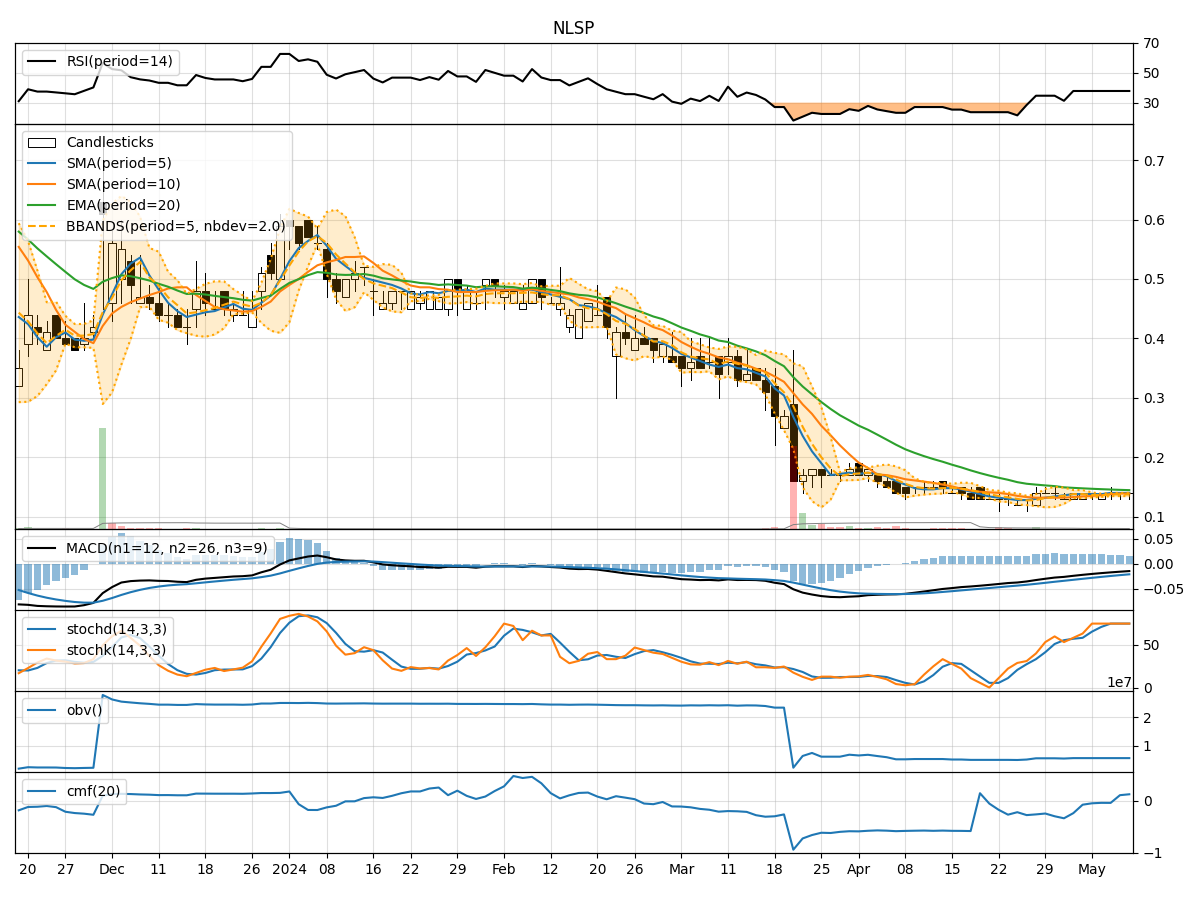
- Moving Averages (MA): The 5-day MA has been consistently above the closing price, indicating a short-term uptrend.
- MACD: The MACD line has been positive, suggesting bullish momentum.
- RSI: The RSI has been fluctuating around the neutral zone, indicating indecision in the market sentiment.
Momentum Analysis:
- Stochastic Oscillator: Both %K and %D have been declining, signaling a potential reversal in momentum.
- Williams %R: The indicator has been in oversold territory, suggesting a possible upcoming price correction.
Volatility Analysis:
- Bollinger Bands (BB): The bands have been narrowing, indicating decreasing volatility.
- BB %B: The %B has been fluctuating, reflecting uncertainty in price direction.
Volume Analysis:
- On-Balance Volume (OBV): The OBV has been declining, indicating selling pressure.
- Chaikin Money Flow (CMF): The CMF has been negative, suggesting outflow of money from the stock.
Key Observations and Opinions:
- Trend: The stock is currently in an upward trend based on moving averages and MACD.
- Momentum: Momentum is showing signs of weakness with stochastic indicators pointing towards a potential reversal.
- Volatility: Volatility is decreasing, indicating a possible period of consolidation.
- Volume: The declining OBV and negative CMF suggest bearish sentiment in the stock.
Conclusion:
Based on the analysis of technical indicators, the next few days for NLSP stock are likely to see further consolidation with a potential downside bias. Investors should exercise caution and closely monitor key support levels for any signs of a trend reversal. Consider waiting for more clarity in market dynamics before making significant investment decisions.