Technical Analysis of QH 2024-05-31
Overview:
In analyzing the technical indicators for QH stock over the last 5 days, we will delve into the trends, momentum, volatility, and volume indicators to provide a comprehensive outlook on the possible stock price movement in the coming days. By examining these key indicators, we aim to offer valuable insights and predictions for potential investors.
Trend Analysis:
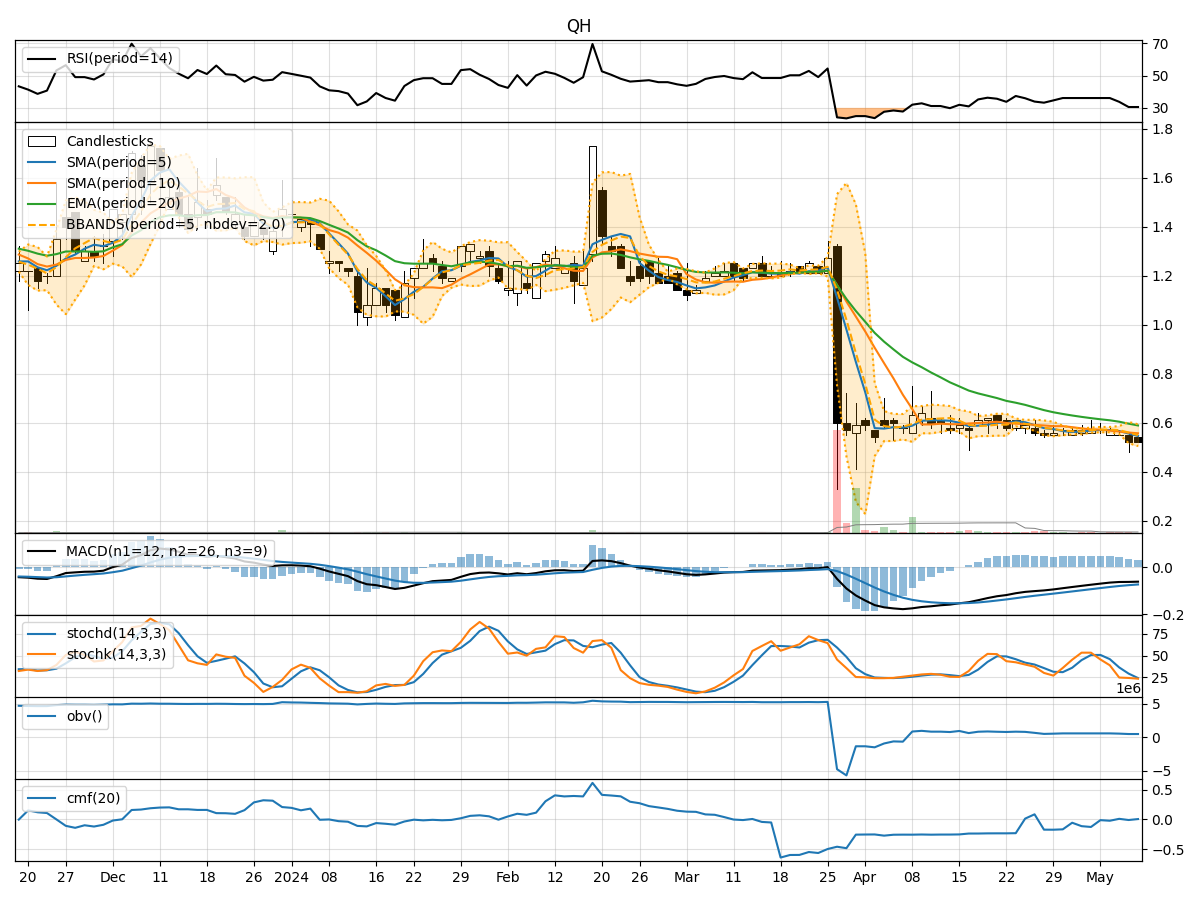
- Moving Averages (MA): The 5-day MA has been gradually decreasing from 0.568 to 0.548, indicating a short-term bearish trend.
- MACD: The MACD line has been consistently negative, suggesting a bearish momentum in the stock price.
- EMA: The EMA has also been declining, further supporting the bearish trend in the stock.
Momentum Analysis:
- RSI: The RSI has been hovering around 40-47, indicating a neutral to slightly bearish momentum.
- Stochastic Oscillator: Both %K and %D have been decreasing, signaling a bearish momentum in the stock price.
- Williams %R: The indicator has been in oversold territory, suggesting a potential reversal or continuation of the bearish trend.
Volatility Analysis:
- Bollinger Bands: The bands have been narrowing, indicating decreasing volatility in the stock price.
- Bollinger %B: The %B has been decreasing, suggesting a potential consolidation phase or a downtrend in the stock.
Volume Analysis:
- On-Balance Volume (OBV): The OBV has been declining, indicating selling pressure in the stock.
- Chaikin Money Flow (CMF): The CMF has been negative, reflecting a bearish sentiment in the stock.
Key Observations:
- The stock is currently in a bearish trend based on moving averages, MACD, and EMA indicators.
- Momentum indicators like RSI and Stochastic Oscillator suggest a bearish sentiment in the stock.
- Volatility is decreasing, potentially leading to a period of consolidation or a continuation of the downtrend.
- Volume indicators show selling pressure and a negative sentiment among investors.
Conclusion:
Based on the analysis of the technical indicators, the next few days' possible stock price movement for QH stock is likely to be downward. The bearish trend indicated by moving averages, MACD, and EMA, coupled with negative momentum and volume indicators, suggests a continuation of the current downtrend. Traders and investors should exercise caution and consider shorting or avoiding long positions until a clear reversal pattern emerges.
Disclaimer:
This analysis is based solely on technical indicators and historical data. Market conditions can change rapidly, and unforeseen events may impact stock prices. It is essential to conduct thorough research and consider other factors before making investment decisions.