Technical Analysis of REE 2024-05-31
Overview:
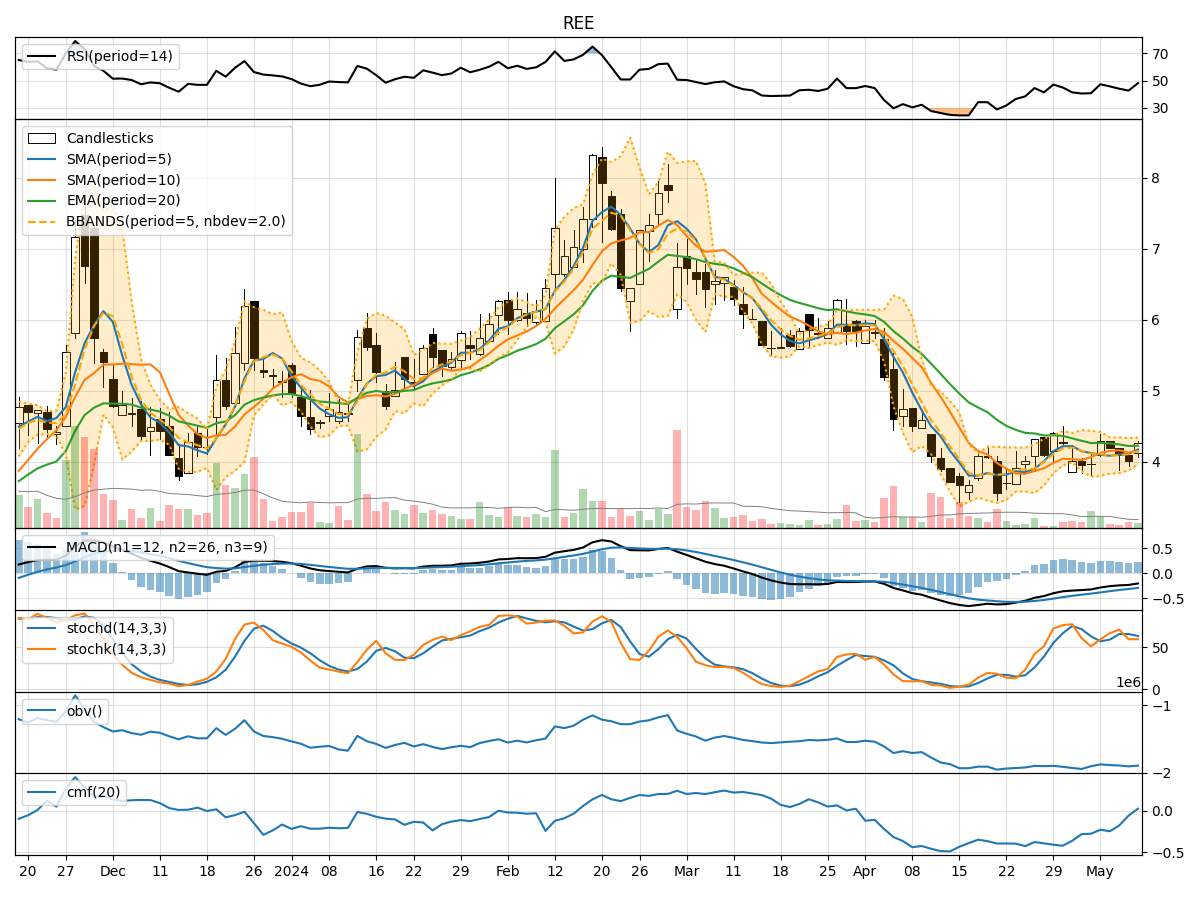
In the last 5 trading days, REE stock has shown a downward trend in both price and volume. The moving averages (MA) have been declining, indicating a bearish trend. Momentum indicators such as RSI and Stochastic Oscillator have also been decreasing, suggesting weakening momentum. Volatility has been increasing as seen in the Bollinger Bands, and volume indicators like OBV and CMF have been negative, showing selling pressure.
Trend Analysis:
- Moving Averages (MA): The 5-day MA has been consistently below the 10-day SMA, indicating a short-term bearish trend. The EMA(20) has also been declining, reflecting a downward price movement.
- MACD: The MACD line has been below the signal line, and both have been decreasing, indicating a bearish trend.
- Momentum Indicators: The MACD Histogram has been negative, suggesting a bearish momentum.
Momentum Analysis:
- RSI: The RSI has been decreasing and is now below 50, indicating weakening buying pressure.
- Stochastic Oscillator: Both %K and %D have been declining, showing a loss in momentum.
- Williams %R: The indicator has been in oversold territory, suggesting a possible reversal or continuation of the downtrend.
Volatility Analysis:
- Bollinger Bands: The bands have been widening, indicating increasing volatility in the stock price.
- Bollinger %B: The %B has been decreasing, showing that the stock price is trading closer to the lower band.
Volume Analysis:
- On-Balance Volume (OBV): The OBV has been negative, indicating more selling volume than buying volume.
- Chaikin Money Flow (CMF): The CMF has been negative, suggesting distribution of the stock.
Conclusion:
Based on the technical indicators and analysis: - Trend: The stock is in a strong downward trend as indicated by the moving averages and MACD. - Momentum: Momentum is bearish with RSI below 50 and Stochastic Oscillator in oversold territory. - Volatility: Volatility is increasing, which may lead to larger price swings. - Volume: Selling pressure is evident with negative OBV and CMF.
Forecast:
Given the current technical indicators and market conditions, the next few days are likely to see a continuation of the downward trend in REE stock. Traders and investors should exercise caution and consider shorting or staying out of long positions until there are clear signs of a trend reversal.