Technical Analysis of SAIA 2024-05-10
Overview:
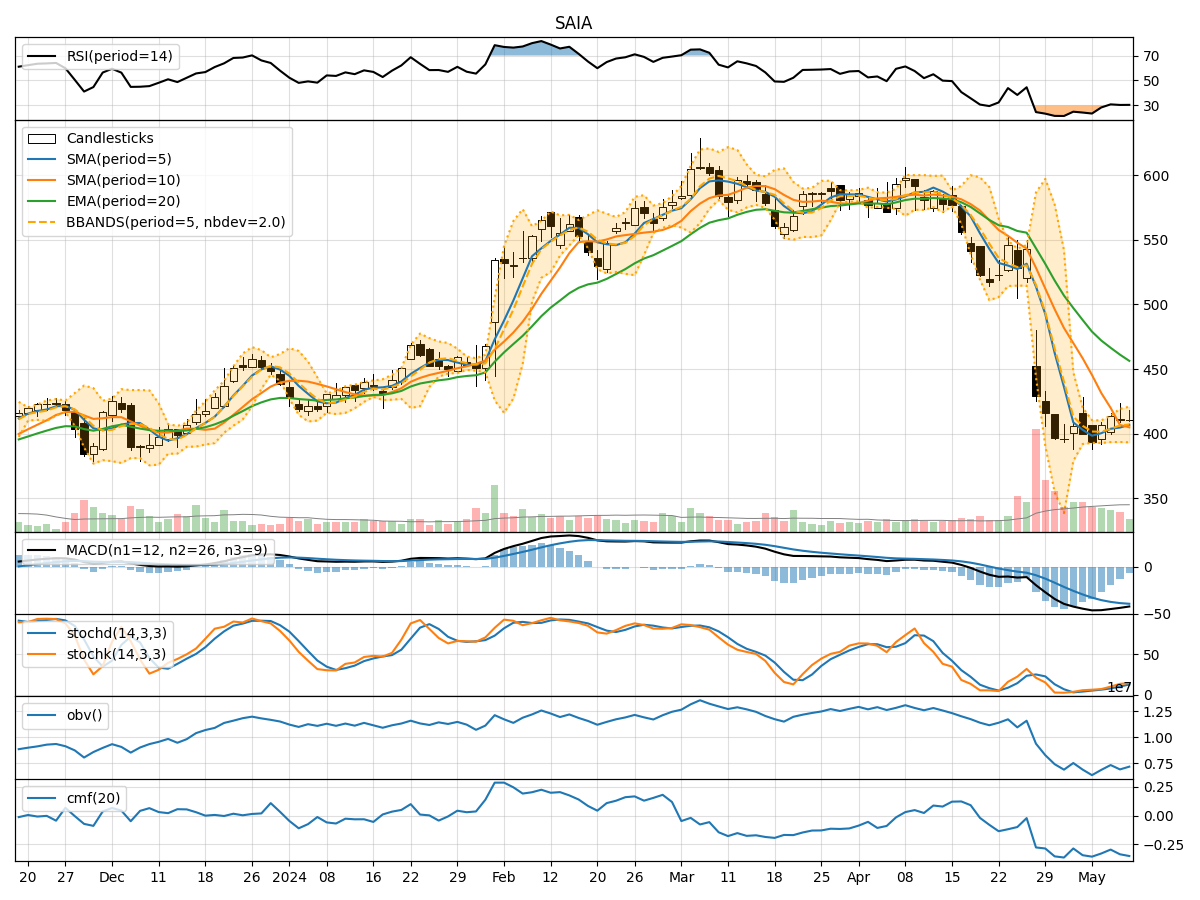
In analyzing the technical indicators for SAIA Inc. (SAIA) over the last 5 days, we will delve into the trend, momentum, volatility, and volume indicators to provide a comprehensive outlook on the possible stock price movement in the coming days. By examining these key indicators, we aim to offer valuable insights and recommendations for potential investors.
Trend Analysis:
- Moving Averages (MA): The 5-day Moving Average (MA) has been showing a slight uptrend, indicating a short-term positive momentum in the stock price.
- MACD: The Moving Average Convergence Divergence (MACD) has been decreasing over the last 5 days, suggesting a weakening bullish momentum.
Momentum Analysis:
- RSI: The Relative Strength Index (RSI) has been gradually increasing but remains in the oversold territory, indicating a potential reversal or consolidation phase.
- Stochastic Oscillator: Both %K and %D of the Stochastic Oscillator have been rising, signaling a strengthening momentum.
Volatility Analysis:
- Bollinger Bands (BB): The Bollinger Bands have been narrowing, indicating decreasing volatility in the stock price.
Volume Analysis:
- On-Balance Volume (OBV): The OBV has been fluctuating but overall showing a slight decrease, suggesting some distribution of shares.
- Chaikin Money Flow (CMF): The CMF has been negative, indicating selling pressure in the stock.
Key Observations and Opinions:
- Trend: The short-term trend is slightly bullish based on the moving averages, but the weakening MACD signals a potential reversal or consolidation phase.
- Momentum: The RSI and Stochastic Oscillator suggest a mixed sentiment with a possibility of a reversal in the oversold territory.
- Volatility: The narrowing Bollinger Bands indicate decreasing volatility, which could lead to a period of consolidation.
- Volume: The OBV and CMF show some selling pressure and distribution of shares, which could impact the stock price movement.
Conclusion:
Based on the analysis of the technical indicators, the next few days for SAIA stock price could see sideways movement or a slight correction. The weakening MACD, mixed momentum indicators, decreasing volatility, and selling pressure in volume indicators suggest a potential consolidation phase or a minor pullback in the stock price. Investors should closely monitor the price action and key support levels for any potential trend reversal or continuation.