Technical Analysis of SIRI 2024-05-31
Overview:
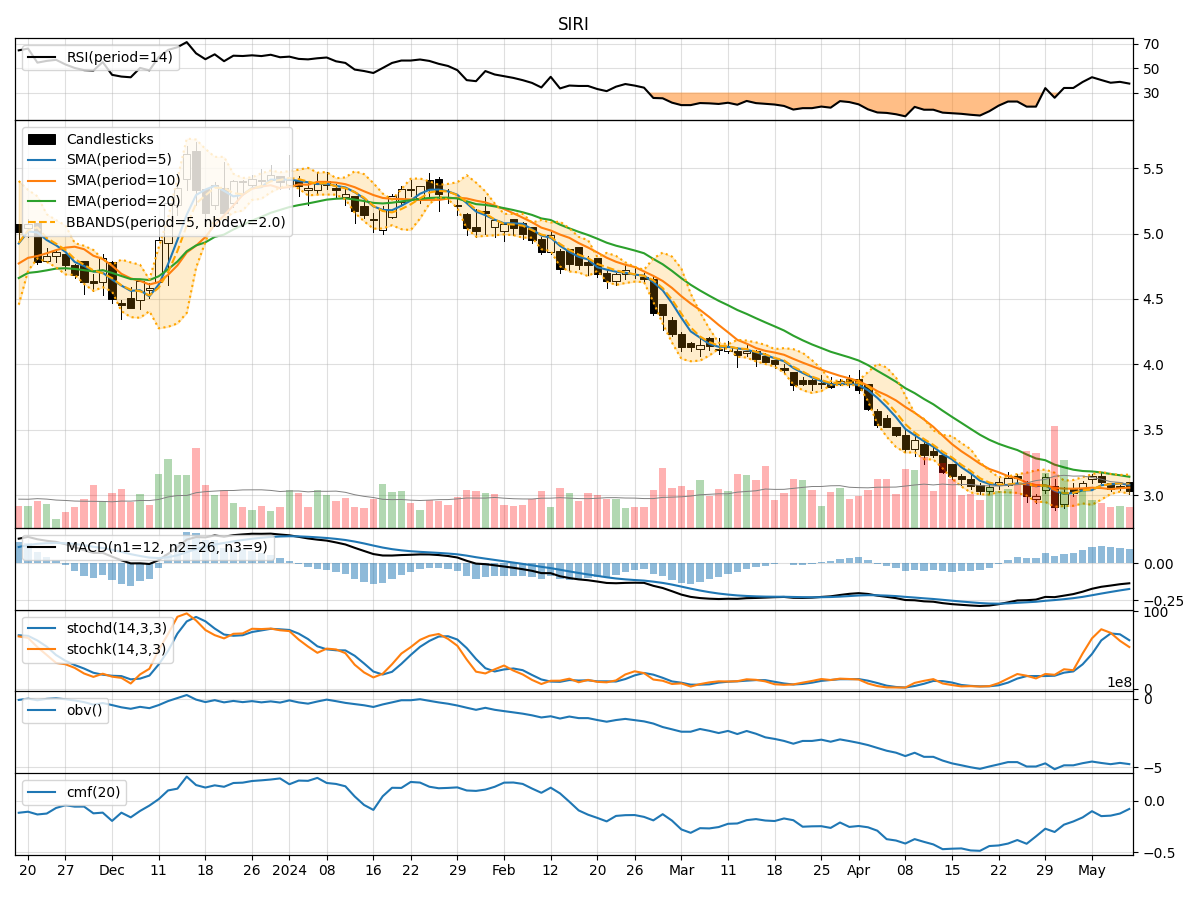
In the last 5 trading days, SIRI stock has shown a downward trend in its closing price, accompanied by fluctuating trading volumes. The trend indicators suggest a bearish sentiment, with moving averages and MACD signaling a negative momentum. The momentum indicators also reflect a bearish outlook, with RSI and stochastic oscillators indicating oversold conditions. Volatility indicators show a narrowing of the Bollinger Bands, indicating decreased price volatility. Volume indicators suggest a negative trend in the On-Balance Volume (OBV) and Chaikin Money Flow (CMF).
Trend Analysis:
- Moving Averages (MA): The 5-day MA is below the 10-day SMA, indicating a short-term bearish trend.
- MACD: The MACD line is below the signal line, confirming a bearish momentum.
- EMA: The EMA is trending downwards, supporting the bearish sentiment.
Momentum Analysis:
- RSI: The RSI is below 30, indicating oversold conditions and a potential reversal.
- Stochastic Oscillators: Both %K and %D are in oversold territory, suggesting a possible upcoming bullish momentum.
Volatility Analysis:
- Bollinger Bands (BB): The bands are narrowing, indicating decreased volatility and a potential breakout.
- Bollinger %B (BBP): The %B is below 0.5, suggesting a possible oversold condition.
Volume Analysis:
- OBV: The OBV is in a downtrend, indicating selling pressure.
- CMF: The CMF is negative, reflecting a bearish money flow.
Conclusion:
Based on the technical indicators analyzed, the stock is currently in a bearish phase with oversold conditions. However, there are signs of a potential reversal in momentum indicated by the oversold RSI and stochastic oscillators. The narrowing Bollinger Bands also suggest a potential breakout in price.
Key Points: - The stock may experience a short-term bounce or consolidation before potentially resuming its downtrend. - Traders should closely monitor the RSI and stochastic indicators for signs of a bullish reversal. - A breakout above the upper Bollinger Band could signal a bullish trend reversal.
Overall, the next few days may see a mix of consolidation and potential bullish momentum, but the overall trend remains bearish.