Technical Analysis of SUUN 2024-05-31
Overview:
In analyzing the technical indicators for SUUN stock over the last 5 days, we will delve into the trend, momentum, volatility, and volume indicators to provide a comprehensive outlook on the possible future stock price movement. By examining key metrics such as moving averages, MACD, RSI, Bollinger Bands, and OBV, we aim to offer valuable insights and predictions for the upcoming trading days.
Trend Indicators:
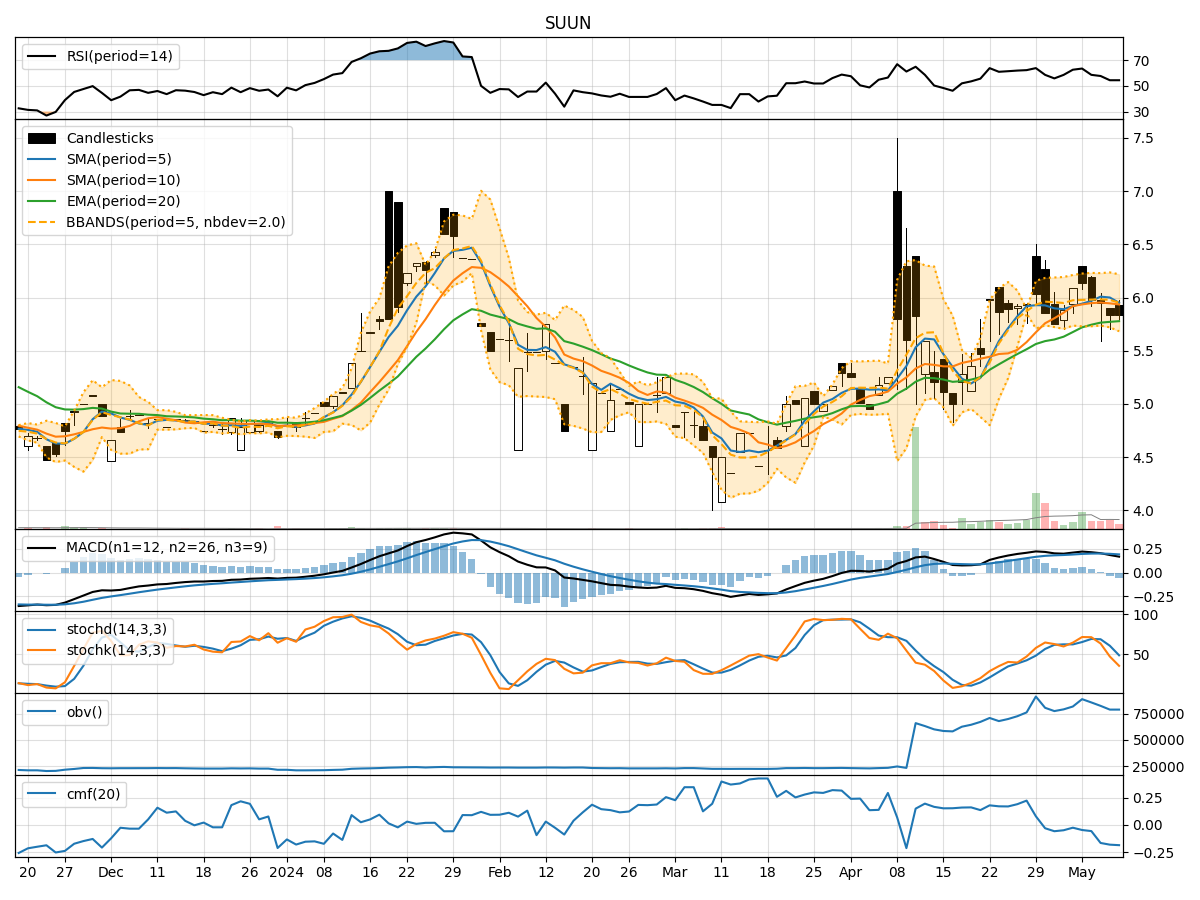
- Moving Averages (MA): The 5-day MA has been consistently below the closing price, indicating a short-term downtrend.
- MACD: The MACD line has been positive but decreasing, while the MACD Histogram has been in negative territory, suggesting a weakening bullish momentum.
- EMA: The EMA has been below the closing price, reflecting a bearish sentiment in the short to medium term.
Momentum Indicators:
- RSI: The RSI has shown fluctuations but has generally been in the neutral zone, indicating indecision among traders.
- Stochastic Oscillator: Both %K and %D have been fluctuating in the oversold region, signaling a potential reversal in the near future.
- Williams %R: The indicator has been consistently in the oversold territory, suggesting a possible buying opportunity.
Volatility Indicators:
- Bollinger Bands: The stock price has been trading below the lower Bollinger Band, indicating an oversold condition.
- Bollinger %B: The %B indicator has been below 0.2, signaling a potential bounce back in price.
- Bollinger Band Width: The Band Width has been widening, suggesting increased volatility in the market.
Volume Indicators:
- On-Balance Volume (OBV): The OBV has been declining, indicating selling pressure in the stock.
- Chaikin Money Flow (CMF): The CMF has been negative, reflecting a lack of buying interest in the stock.
Key Observations and Opinions:
- Trend: The stock is currently in a short-term downtrend, as indicated by the moving averages and EMA.
- Momentum: Momentum indicators suggest a potential reversal in the near future, with stochastic oscillators hinting at a buying opportunity.
- Volatility: Increased volatility, as shown by Bollinger Bands, could lead to a potential price reversal.
- Volume: Declining OBV and negative CMF indicate a lack of buying interest and selling pressure in the stock.
Conclusion:
Based on the analysis of the technical indicators, the stock is currently in a bearish phase with a potential for a short-term reversal in the upcoming trading days. Traders should exercise caution and closely monitor key levels such as the lower Bollinger Band and oversold conditions in momentum indicators for potential buying opportunities. However, the overall outlook remains bearish until a clear trend reversal is confirmed.