Technical Analysis of SYM 2024-05-31
Overview:
In analyzing the technical indicators for the stock symbol (SYM) over the last 5 days, we will delve into the trend, momentum, volatility, and volume indicators to provide a comprehensive outlook on the possible stock price movement in the upcoming days. By examining these key indicators, we aim to offer valuable insights and recommendations for potential investors.
Trend Analysis:
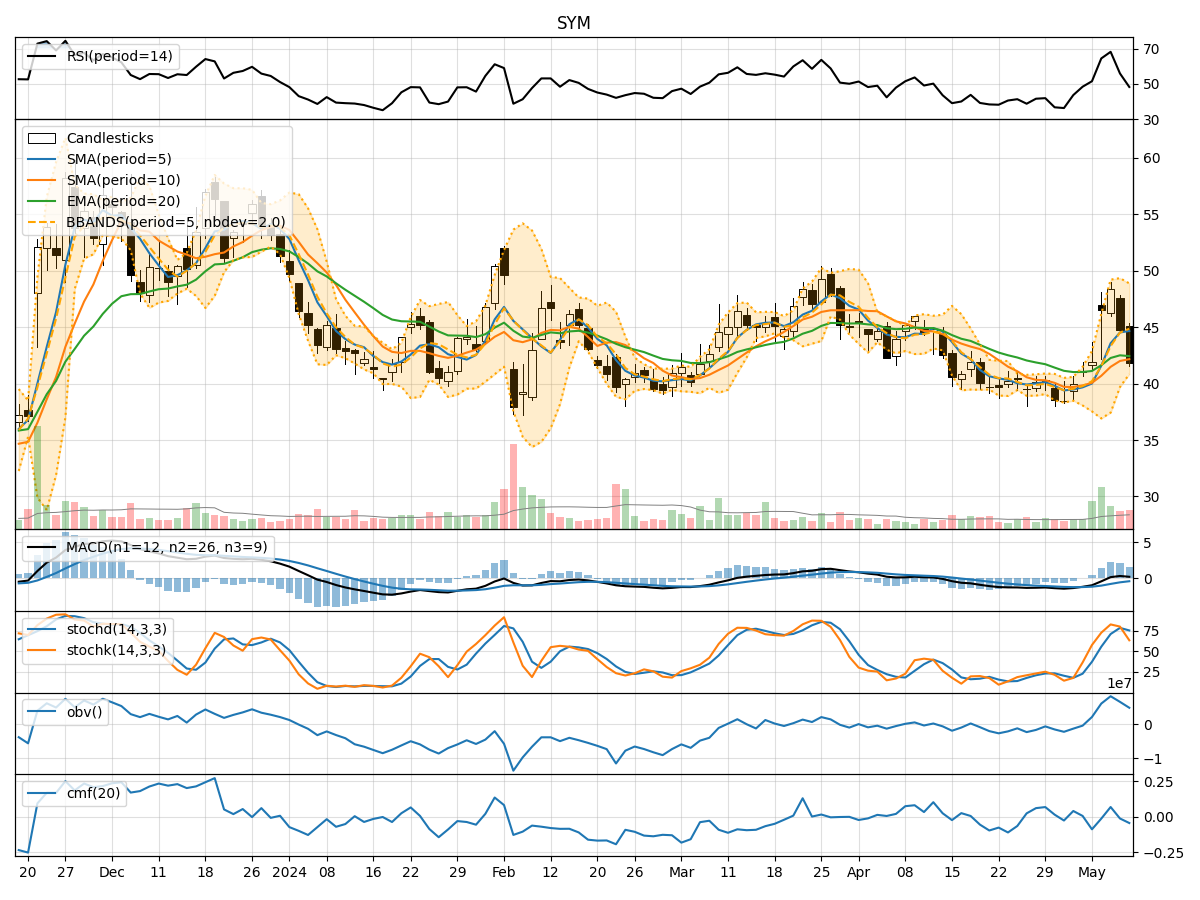
- Moving Averages (MA): The 5-day MA has been consistently below the closing prices, indicating a downward trend.
- MACD: The MACD line has been decreasing, with the MACD histogram also showing a downward trend.
- EMA: The EMA has been declining, further supporting the bearish sentiment in the short term.
Momentum Analysis:
- RSI: The RSI has been fluctuating but generally trending downwards, suggesting weakening momentum.
- Stochastic Oscillator: Both %K and %D have been relatively low, indicating oversold conditions.
- Williams %R: The indicator has been consistently in the oversold territory, signaling a bearish momentum.
Volatility Analysis:
- Bollinger Bands (BB): The stock price has been consistently below the middle Bollinger Band, indicating a bearish trend.
- BB Width: The bands have been narrowing, suggesting decreasing volatility.
- BB %B: The %B indicator has been below 0.2, indicating a potential oversold condition.
Volume Analysis:
- On-Balance Volume (OBV): The OBV has been declining, reflecting selling pressure in the market.
- Chaikin Money Flow (CMF): The CMF has been negative, indicating a lack of buying interest.
Key Observations and Opinions:
- Trend: The trend indicators suggest a clear downward trend in the stock price.
- Momentum: Momentum indicators point towards bearish momentum with oversold conditions.
- Volatility: Volatility indicators show a decreasing volatility environment.
- Volume: Volume indicators reflect selling pressure and a lack of buying interest.
Conclusion:
Based on the analysis of the technical indicators, the overall outlook for the stock symbol (SYM) in the next few days appears bearish. The stock is likely to continue its downward trend with weakening momentum, low volatility, and persistent selling pressure. Investors should exercise caution and consider waiting for more favorable conditions before considering any long positions.