Technical Analysis of TRVG 2024-05-31
Overview:
In analyzing the technical indicators for TRVG over the last 5 days, we will delve into the trend, momentum, volatility, and volume indicators to provide a comprehensive outlook on the possible stock price movement in the coming days. By examining these key indicators, we aim to offer valuable insights and predictions to guide your investment decisions.
Trend Analysis:
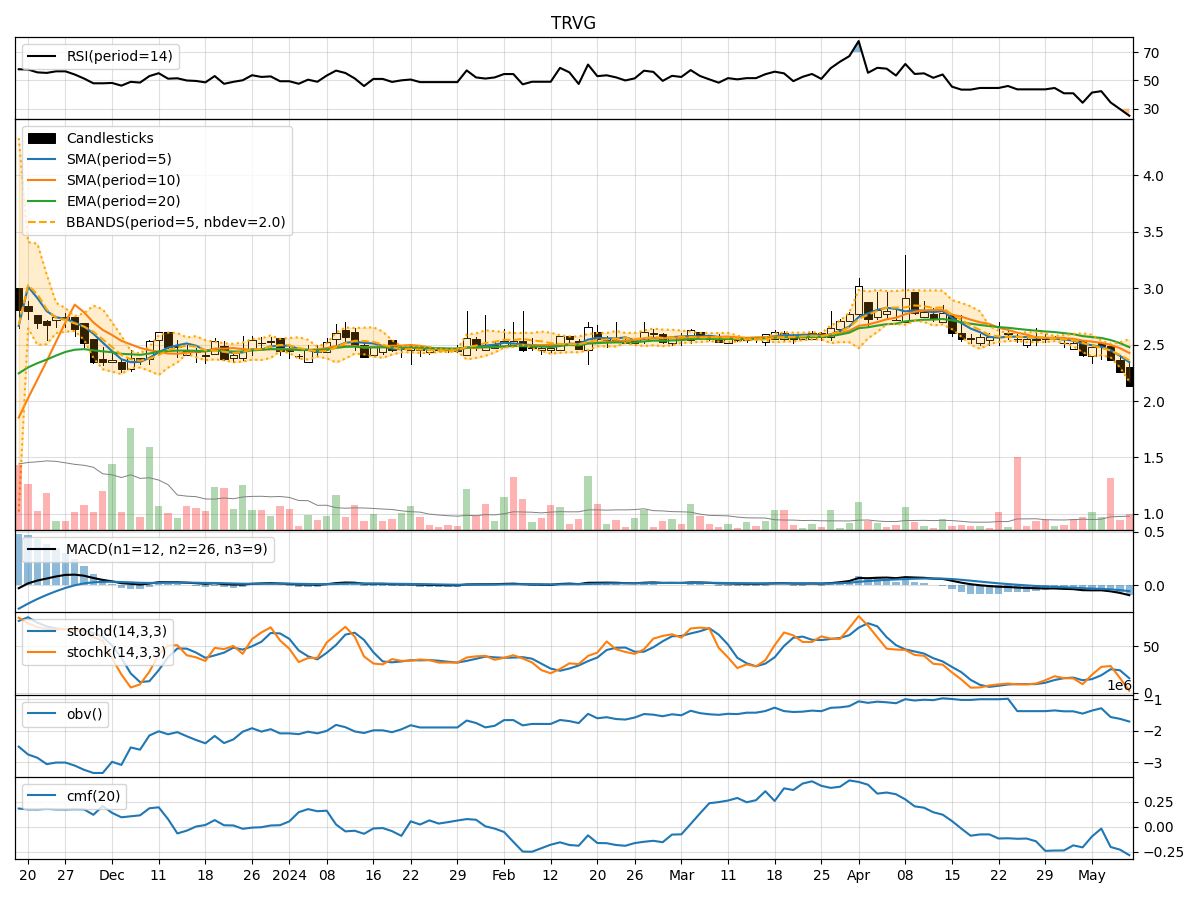
- Moving Averages (MA): The 5-day Moving Average (MA) has been fluctuating around the closing prices, indicating short-term price trends. The Simple Moving Average (SMA) and Exponential Moving Average (EMA) show a slight upward trend, suggesting potential bullish momentum.
- MACD: The Moving Average Convergence Divergence (MACD) has been negative but showing signs of convergence towards the signal line, hinting at a possible trend reversal.
- Conclusion: The trend indicators suggest a potential bullish reversal in the short term.
Momentum Analysis:
- RSI: The Relative Strength Index (RSI) has been hovering around the neutral zone, indicating a balanced momentum between buying and selling pressure.
- Stochastic Oscillator: Both %K and %D have been fluctuating, reflecting indecision in the market momentum.
- Conclusion: The momentum indicators suggest a sideways movement with no clear direction.
Volatility Analysis:
- Bollinger Bands (BB): The Bollinger Bands have been narrowing, indicating decreasing volatility and a potential price breakout in the near future.
- Conclusion: The volatility indicators suggest a potential price breakout due to the tightening Bollinger Bands.
Volume Analysis:
- On-Balance Volume (OBV): The OBV has been fluctuating, suggesting mixed buying and selling pressure.
- Chaikin Money Flow (CMF): The CMF has been negative, indicating a slight outflow of money from the stock.
- Conclusion: The volume indicators suggest mixed sentiment with no clear dominance of buying or selling pressure.
Overall Conclusion:
Based on the analysis of the technical indicators, the stock price of TRVG is likely to experience a bullish reversal in the short term, supported by the trend indicators showing signs of upward momentum. However, the momentum indicators suggest a sideways movement with no clear direction, while the volatility indicators point towards a potential price breakout due to decreasing volatility. The volume indicators indicate mixed sentiment with no clear dominance of buying or selling pressure.
Recommendation:
Considering the overall analysis, it is advisable to monitor the stock closely for signs of a confirmed bullish trend before making any significant investment decisions. Traders may consider waiting for a clear breakout supported by increasing volume to confirm the bullish reversal. Additionally, keeping an eye on key resistance levels and volume spikes can provide valuable insights into the stock's future price movement.
Disclaimer:
Remember that technical analysis is not a guaranteed predictor of future price movements, and other fundamental factors and market dynamics can influence stock prices. It is essential to conduct thorough research and consider multiple indicators before making any investment decisions. Consulting with a financial advisor can provide tailored recommendations based on your specific investment goals and risk tolerance level.