Technical Analysis of VIR 2024-05-31
Overview:
In analyzing the technical indicators for VIR over the last 5 days, we will delve into the trend, momentum, volatility, and volume indicators to provide a comprehensive outlook on the possible stock price movement in the coming days.
Trend Analysis:
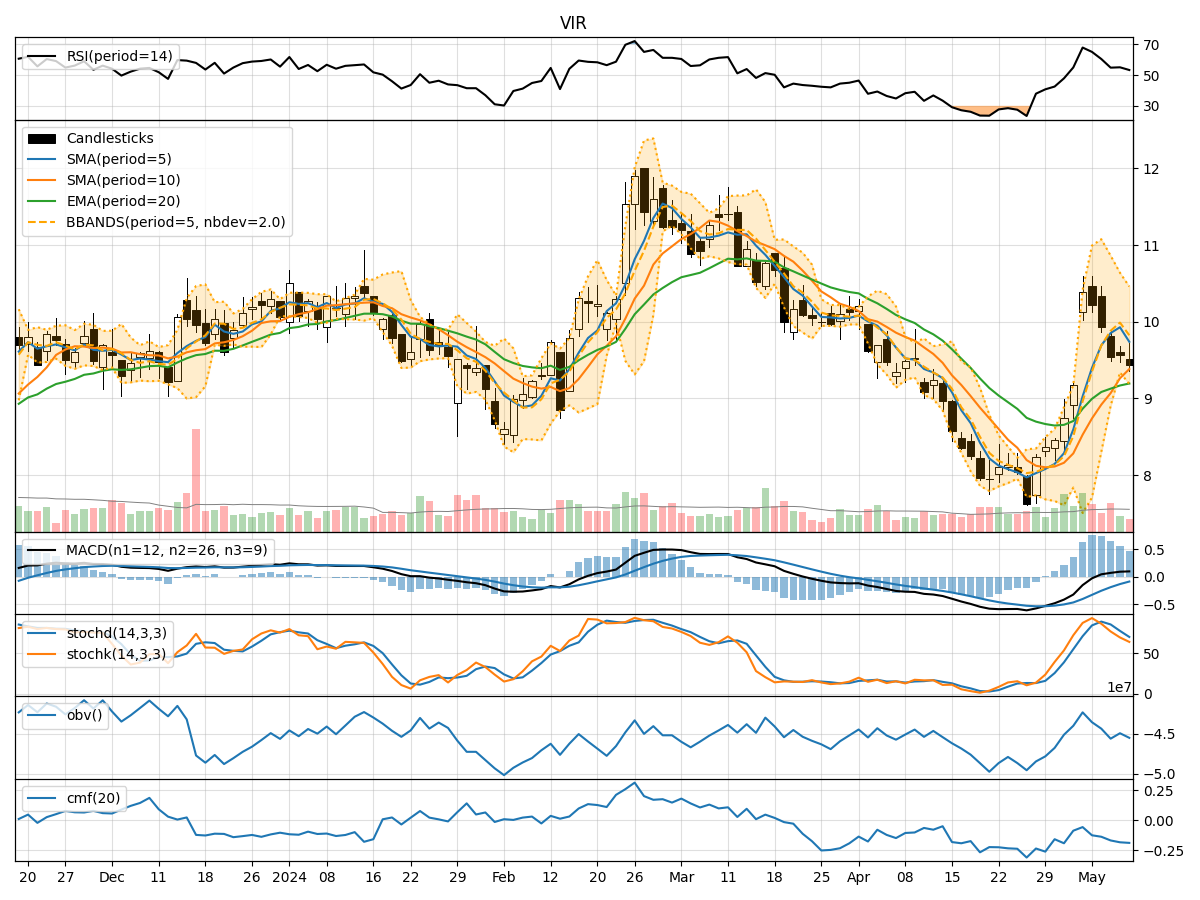
- Moving Averages (MA): The 5-day Moving Average (MA) has been fluctuating around the closing prices, indicating short-term price trends. The Simple Moving Average (SMA) and Exponential Moving Average (EMA) show an upward trend, suggesting a positive momentum.
- MACD: The Moving Average Convergence Divergence (MACD) and its signal line (MACDH) have been consistently positive, indicating a bullish trend.
Momentum Analysis:
- RSI: The Relative Strength Index (RSI) has been hovering around the neutral zone, indicating a balanced momentum.
- Stochastic Oscillator: Both %K and %D have been fluctuating, suggesting indecision in momentum.
- Williams %R: The Williams %R is in oversold territory, indicating a potential reversal.
Volatility Analysis:
- Bollinger Bands (BB): The Bollinger Bands have been narrowing, indicating decreasing volatility.
Volume Analysis:
- On-Balance Volume (OBV): The OBV has been fluctuating, suggesting mixed sentiment among investors.
- Chaikin Money Flow (CMF): The CMF has been negative, indicating selling pressure.
Key Observations:
- The trend indicators suggest a bullish sentiment with positive moving averages and MACD.
- Momentum indicators show mixed signals with RSI in a neutral zone and stochastic oscillators fluctuating.
- Volatility has been decreasing, indicating potential consolidation.
- Volume indicators reflect mixed sentiment with fluctuating OBV and negative CMF.
Conclusion:
Based on the analysis of technical indicators, the next few days for VIR stock price movement could be sideways with a slight bullish bias. The positive trend indicators and decreasing volatility suggest a potential consolidation phase, while mixed momentum and volume indicators indicate indecision among investors. It is advisable to closely monitor price action and key support/resistance levels for potential breakout or reversal signals.