Technical Analysis of VRSN 2024-05-31
Overview:
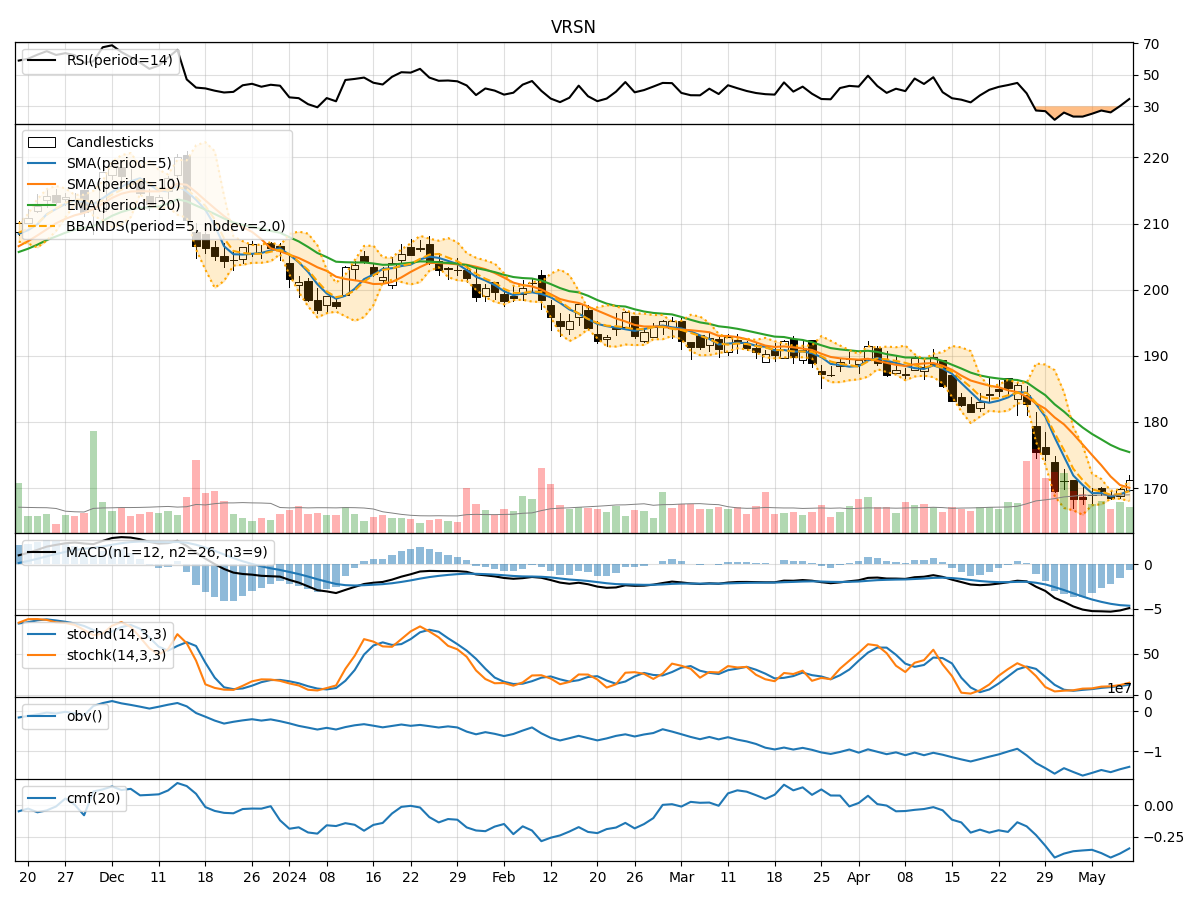
In analyzing the technical indicators for Verisign Inc. (VRSN) over the last 5 days, we will delve into the trends, momentum, volatility, and volume indicators to provide insights into the possible future stock price movements. By examining these indicators, we aim to offer a comprehensive analysis and make informed predictions for the upcoming days.
Trend Analysis:
- Moving Averages (MA): The 5-day Moving Average (MA) has been consistently below the closing prices, indicating a short-term downtrend.
- MACD: The Moving Average Convergence Divergence (MACD) has shown negative values, suggesting a bearish momentum in the stock.
- EMA: The Exponential Moving Average (EMA) has been declining, further supporting the bearish trend in the stock.
Momentum Analysis:
- RSI: The Relative Strength Index (RSI) has been fluctuating around the 50 level, indicating a lack of strong momentum in either direction.
- Stochastic Oscillator: Both %K and %D have been trending lower, reflecting a weakening momentum in the stock.
- Williams %R: The Williams %R is in oversold territory, suggesting a potential reversal or bounce in the stock price.
Volatility Analysis:
- Bollinger Bands: The Bollinger Bands have been narrowing, indicating decreasing volatility in the stock.
- Bollinger %B: The %B indicator is hovering around the middle, suggesting a neutral stance in terms of volatility.
Volume Analysis:
- On-Balance Volume (OBV): The OBV has been declining, indicating selling pressure in the stock.
- Chaikin Money Flow (CMF): The CMF has shown a slight uptick, suggesting some buying interest in the stock.
Key Observations:
- The stock is currently in a downtrend based on the moving averages and MACD.
- Momentum indicators are showing weakness in the stock's price movement.
- Volatility is decreasing, indicating a potential period of consolidation.
- Volume indicators suggest selling pressure but with a slight uptick in buying interest.
Conclusion:
Based on the analysis of the technical indicators, the next few days for VRSN are likely to see further downside movement in the stock price. The bearish trend indicated by the moving averages and MACD, coupled with weakening momentum and selling pressure, suggest that the stock may continue its downward trajectory. Traders and investors should exercise caution and consider short-term strategies to capitalize on potential downside opportunities.