Technical Analysis of WDC 2024-05-31
Overview:
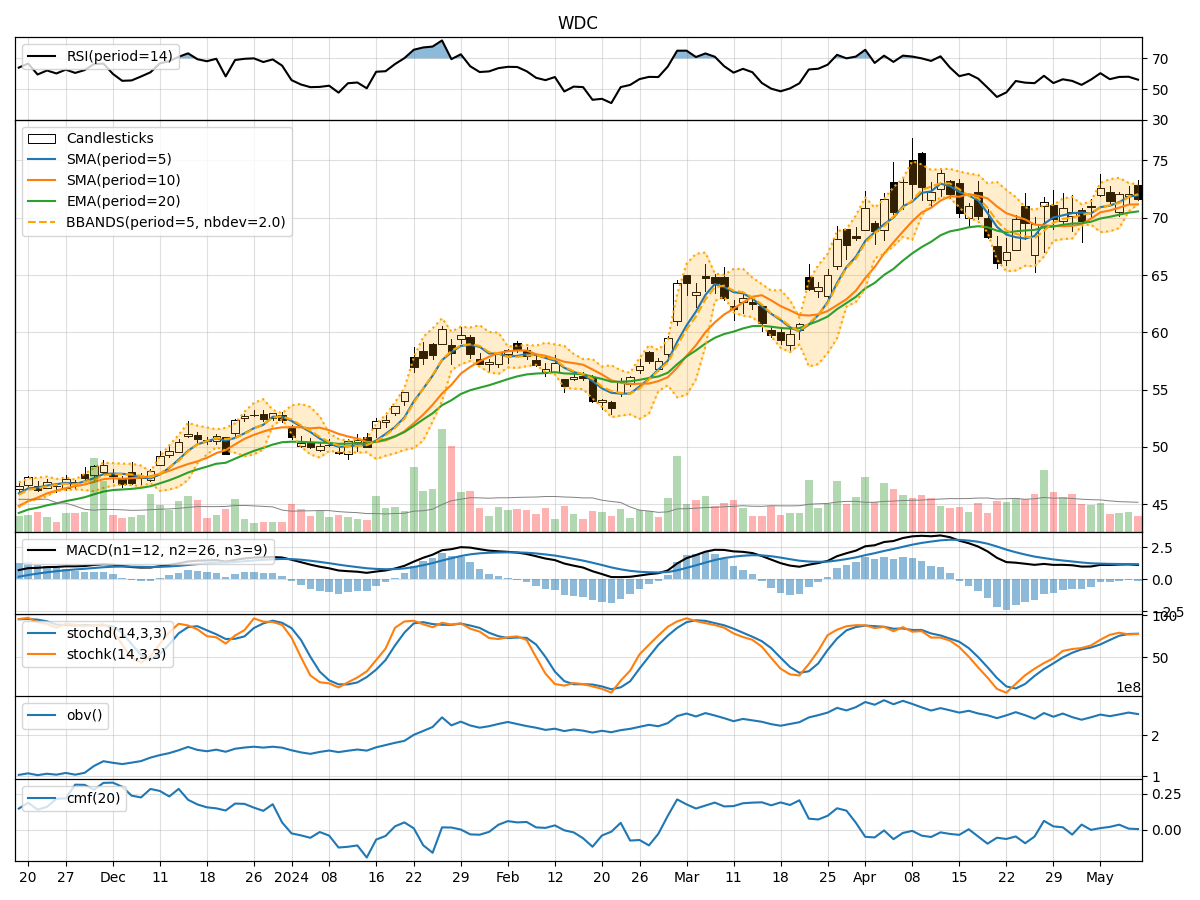
In analyzing the technical indicators for WDC over the last 5 days, we will delve into the trend, momentum, volatility, and volume indicators to provide a comprehensive outlook on the possible stock price movement. By examining these key aspects, we aim to offer valuable insights and predictions for the upcoming days.
Trend Analysis:
- Moving Averages (MA): The 5-day Moving Average (MA) has been consistently above the Simple Moving Average (SMA) and Exponential Moving Average (EMA), indicating a bullish trend.
- MACD: The MACD line has been above the signal line, with both lines showing an upward trend, suggesting bullish momentum.
Momentum Analysis:
- RSI: The Relative Strength Index (RSI) has been fluctuating around the 60-70 range, indicating moderate bullish momentum.
- Stochastic Oscillator: Both %K and %D have been in the overbought zone, suggesting a potential reversal or consolidation.
Volatility Analysis:
- Bollinger Bands (BB): The stock price has been trading within the upper Bollinger Band (BBU), indicating an overbought condition.
Volume Analysis:
- On-Balance Volume (OBV): The OBV has shown mixed signals, with fluctuations in volume accumulation.
- Chaikin Money Flow (CMF): The CMF has been positive, indicating buying pressure in the market.
Key Observations:
- The trend indicators suggest a bullish sentiment in the short term.
- Momentum indicators show a potential overbought condition, signaling a need for caution.
- Volatility indicators point towards a high level of price fluctuation.
- Volume indicators reflect mixed signals in terms of buying pressure.
Conclusion:
Based on the analysis of the technical indicators, the next few days' possible stock price movement for WDC is likely to be sideways to slightly bearish. While the trend indicators remain bullish, the overbought signals from the momentum indicators and the overbought condition indicated by the Bollinger Bands suggest a potential pullback or consolidation in the near future. Traders should exercise caution and consider taking profits or implementing risk management strategies in anticipation of a possible correction.