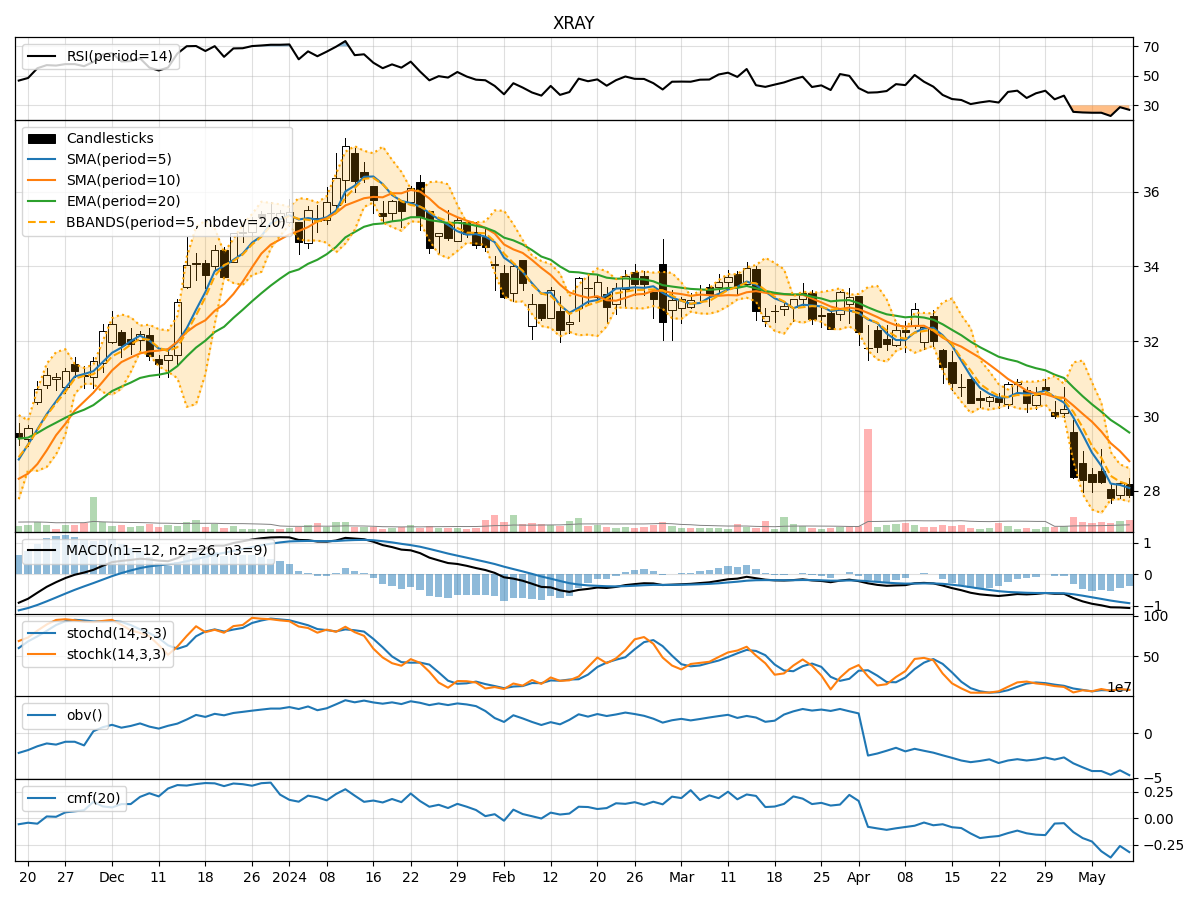
Technical Analysis of XRAY 2024-05-31
Overview:
In analyzing the technical indicators for XRAY over the last 5 days, we will delve into the trend, momentum, volatility, and volume indicators to provide a comprehensive outlook on the possible stock price movement in the coming days.
Trend Analysis:
- Moving Averages (MA): The 5-day MA has been consistently below the closing price, indicating a short-term downtrend.
- MACD: The MACD line has been negative, suggesting bearish momentum.
- EMA: The EMA has been declining, further supporting the bearish trend.
Momentum Analysis:
- RSI: The RSI has been relatively low, indicating oversold conditions.
- Stochastic Oscillator: Both %K and %D have been increasing, signaling potential upward momentum.
- Williams %R: The indicator has been moving towards the oversold region, hinting at a possible reversal.
Volatility Analysis:
- Bollinger Bands (BB): The bands have been narrowing, suggesting decreased volatility.
- BB %B: The %B has been fluctuating within a tight range, indicating consolidation.
- BB Width: The width of the bands has been decreasing, pointing towards a potential breakout.
Volume Analysis:
- On-Balance Volume (OBV): The OBV has been declining, indicating selling pressure.
- Chaikin Money Flow (CMF): The CMF has been negative, reflecting outflow of money from the stock.
Key Observations:
- The trend indicators show a bearish bias with declining moving averages and negative MACD.
- Momentum indicators suggest a possible reversal with oversold RSI and stochastic oscillators.
- Volatility indicators point towards a period of consolidation with decreasing Bollinger Band width.
- Volume indicators indicate selling pressure with declining OBV and negative CMF.
Conclusion:
Based on the analysis of the technical indicators, the next few days for XRAY stock price movement could see a potential reversal in the downtrend. The momentum indicators are showing signs of a shift towards bullish momentum, supported by oversold conditions and increasing stochastic oscillators. However, the overall trend remains bearish, so it is crucial to monitor the price action closely for confirmation of a trend reversal. Traders should consider cautious optimism in the short term, as the stock may experience a period of consolidation before a clear direction emerges.