Technical Analysis of ZG 2024-05-31
Overview:
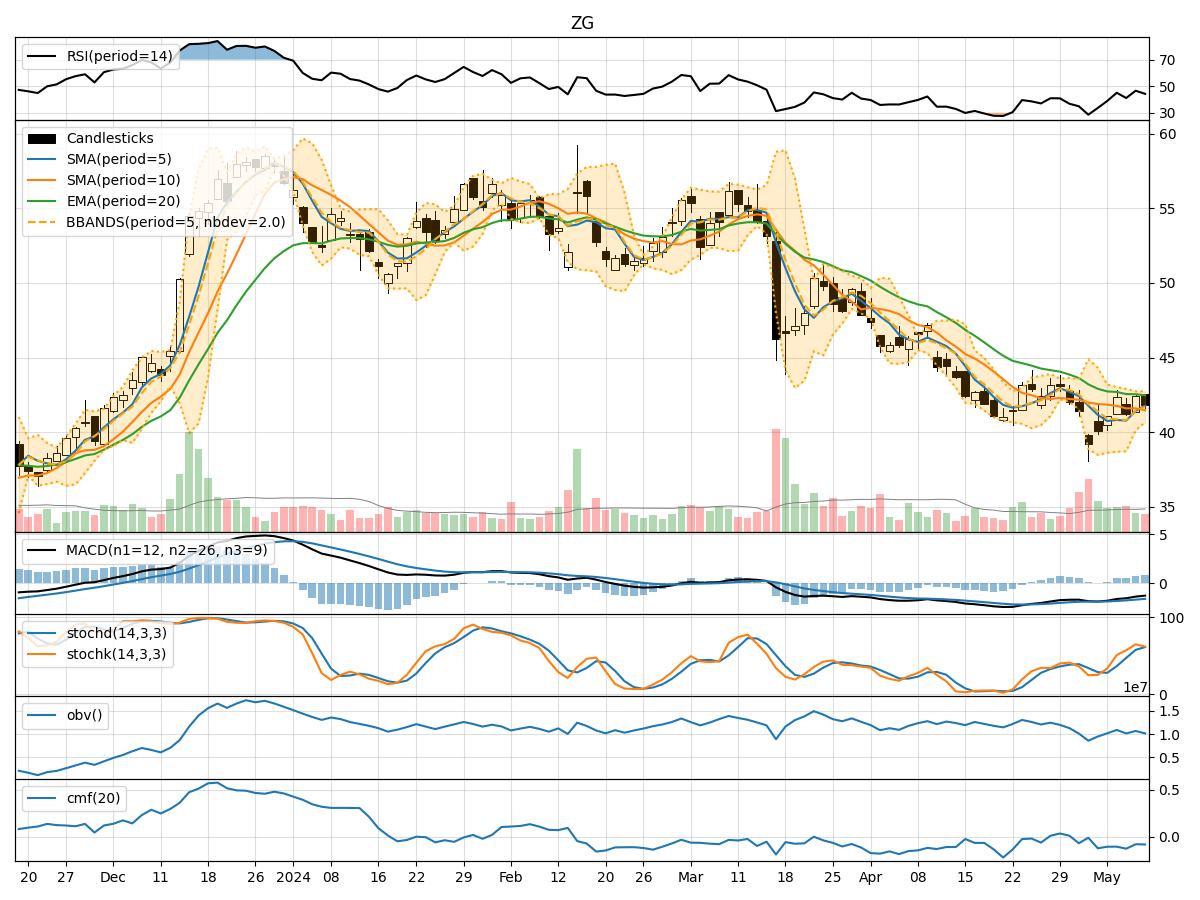
In analyzing the technical indicators for ZG over the last 5 days, we will delve into the trend, momentum, volatility, and volume indicators to provide a comprehensive outlook on the possible stock price movement in the coming days.
Trend Analysis:
- Moving Averages (MA): The 5-day MA has been consistently below the closing prices, indicating a downward trend.
- MACD: The MACD line has been negative, with the MACD histogram also showing a downward trend.
- Conclusion: The trend indicators suggest a bearish outlook for ZG.
Momentum Analysis:
- RSI: The RSI values have been relatively low, indicating oversold conditions.
- Stochastic Oscillator: Both %K and %D values have been low, suggesting a lack of buying momentum.
- Conclusion: The momentum indicators point towards a bearish sentiment in the market.
Volatility Analysis:
- Bollinger Bands (BB): The stock price has been consistently below the middle Bollinger Band, indicating lower volatility.
- Conclusion: Volatility indicators suggest a sideways or consolidation phase for ZG.
Volume Analysis:
- On-Balance Volume (OBV): The OBV values have been consistently negative, indicating selling pressure.
- Chaikin Money Flow (CMF): The CMF values have been negative, reflecting a lack of buying interest.
- Conclusion: Volume indicators support a bearish sentiment in the market.
Conclusion:
Based on the analysis of trend, momentum, volatility, and volume indicators, the overall outlook for ZG in the next few days is bearish. The stock is likely to experience further downward pressure, with a potential for continued decline in stock price. Traders and investors should exercise caution and consider shorting or staying on the sidelines until there are clear signs of a reversal in the technical indicators.
Key Recommendations:
- Short-Term Traders: Consider shorting ZG or adopting a wait-and-see approach until a clear trend reversal is observed.
- Long-Term Investors: Monitor the technical indicators closely and consider potential entry points at lower price levels.
- Risk Management: Implement stop-loss orders to protect against further downside risk.
- Market Monitoring: Stay updated on company news and broader market trends that could impact ZG's stock price.
Disclaimer:
Remember that technical analysis is not foolproof and market conditions can change rapidly. It is essential to conduct thorough research, consider multiple indicators, and consult with a financial advisor before making any investment decisions.