Technical Analysis of AEM 2024-05-31
Overview:
In analyzing the technical indicators for AEM over the last 5 days, we will delve into the trend, momentum, volatility, and volume indicators to provide a comprehensive outlook on the possible stock price movement in the coming days. By examining these key aspects, we aim to offer valuable insights and predictions for informed decision-making.
Trend Analysis:
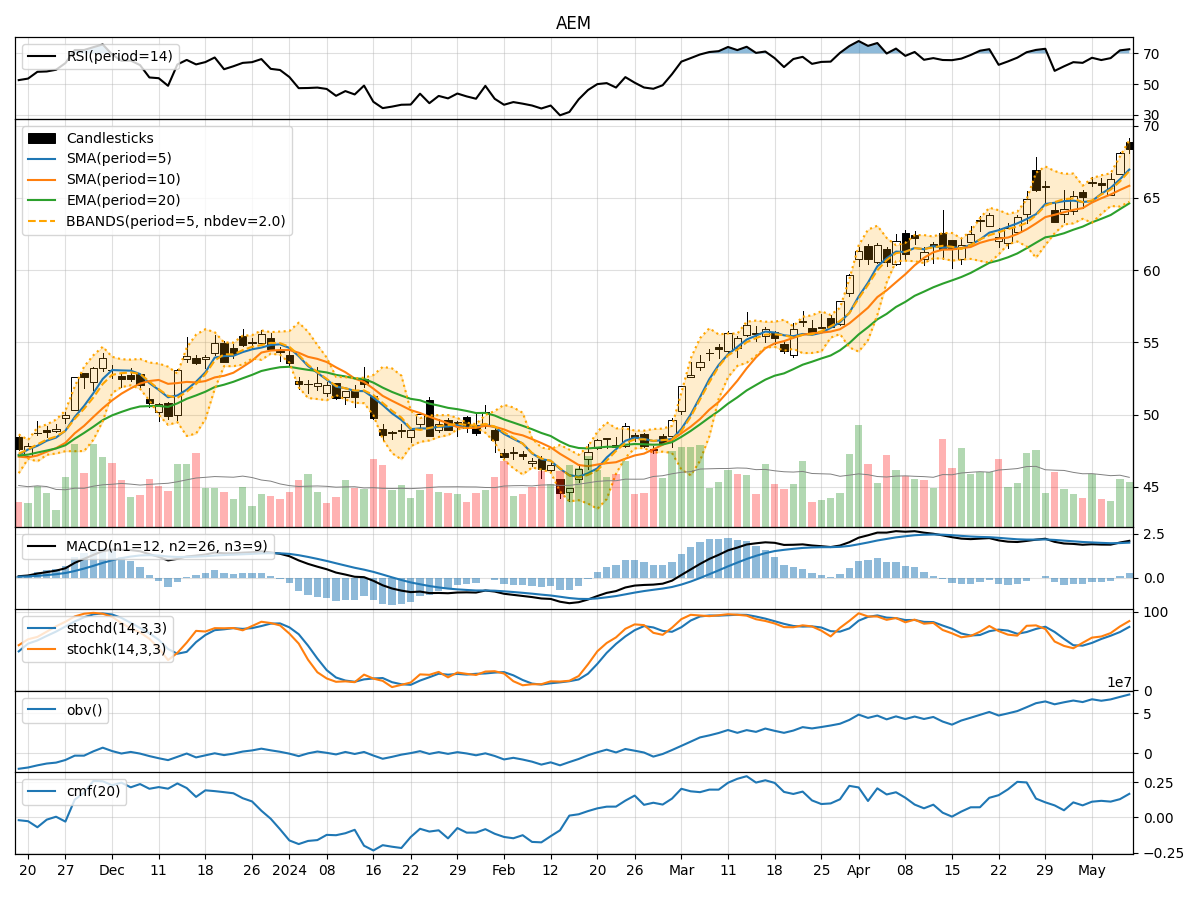
- Moving Averages (MA): The 5-day MA has been fluctuating around the stock price, indicating short-term volatility. The SMA(10) and EMA(20) show a slight downward trend, suggesting a potential bearish sentiment.
- MACD: The MACD line has been decreasing, with the MACD histogram also showing a downward trend. This indicates a weakening bullish momentum.
Momentum Analysis:
- RSI: The RSI has been oscillating around the mid-level, indicating a lack of strong momentum in either direction.
- Stochastic Oscillator: Both %K and %D have been declining, suggesting a potential shift towards oversold conditions.
Volatility Analysis:
- Bollinger Bands (BB): The bands have been narrowing, indicating decreasing volatility. The current price is within the bands, suggesting a period of consolidation.
Volume Analysis:
- On-Balance Volume (OBV): The OBV has been relatively stable, indicating a balance between buying and selling pressure.
- Chaikin Money Flow (CMF): The CMF has been positive, indicating a potential inflow of money into the stock.
Key Observations:
- The trend indicators point towards a bearish sentiment, with a weakening bullish momentum.
- Momentum indicators suggest a lack of strong directional momentum.
- Volatility is decreasing, indicating a period of consolidation.
- Volume indicators show a balance between buying and selling pressure.
Conclusion:
Based on the analysis of the technical indicators, the stock price of AEM is likely to experience sideways movement in the coming days. The bearish trend, coupled with weakening momentum, suggests a lack of clear direction. The decreasing volatility and balanced volume further support the view of consolidation. Traders may expect the stock price to remain range-bound without significant upward or downward movements in the near term.