Technical Analysis of AXP 2024-05-10
Overview:
In analyzing the technical indicators for American Express (AXP) over the last 5 days, we will delve into the trend, momentum, volatility, and volume indicators to provide a comprehensive outlook on the possible stock price movement. By examining these key factors, we aim to offer valuable insights and predictions for the upcoming days.
Trend Analysis:
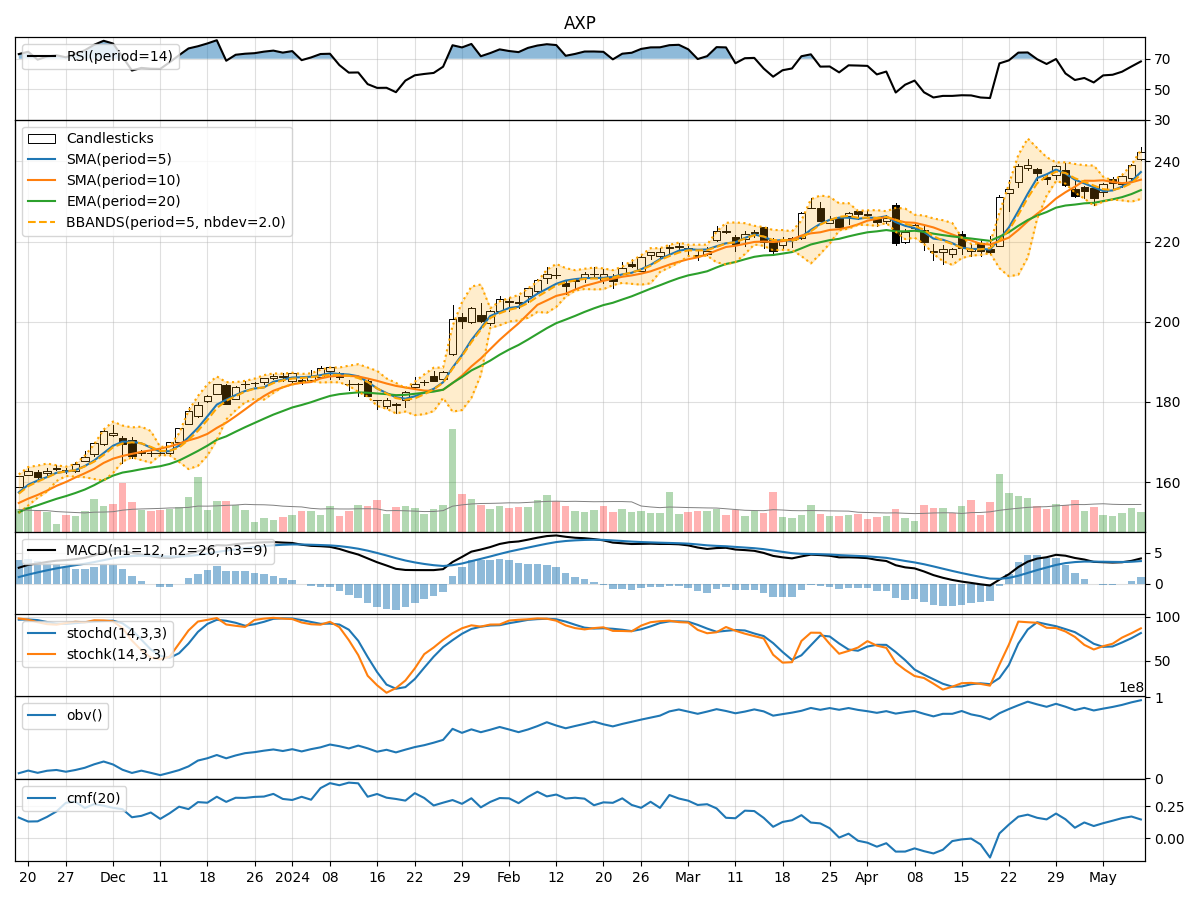
- Moving Averages (MA): The 5-day Moving Average (MA) has been consistently rising, indicating a bullish trend in the short term.
- MACD: The MACD line has been above the signal line, suggesting a bullish momentum.
- EMA: The Exponential Moving Average (EMA) has been trending upwards, supporting the bullish sentiment.
Momentum Analysis:
- RSI: The Relative Strength Index (RSI) has been increasing, showing strengthening momentum.
- Stochastic Oscillator: Both %K and %D have been rising, indicating increasing buying pressure.
- Williams %R: The indicator has been moving towards the oversold region, suggesting a potential reversal.
Volatility Analysis:
- Bollinger Bands (BB): The stock price has been trading above the middle Bollinger Band, indicating an uptrend.
- Bollinger Band Width: The band width has been expanding, suggesting increased volatility.
- Bollinger Band %B: The %B indicator has been above 0.8, indicating a strong bullish momentum.
Volume Analysis:
- On-Balance Volume (OBV): The OBV has been steadily increasing, reflecting accumulation by investors.
- Chaikin Money Flow (CMF): The CMF has been positive, indicating buying pressure in the stock.
Key Observations:
- The technical indicators collectively suggest a bullish outlook for AXP in the upcoming days.
- The trend indicators, momentum oscillators, and volume indicators all point towards a continuation of the current uptrend.
- The expanding Bollinger Band width indicates potential for increased price volatility.
Conclusion:
Based on the analysis of the technical indicators, it is highly likely that AXP will experience further upward movement in the next few days. Traders and investors may consider buying opportunities in line with the bullish trend. However, it is essential to monitor the indicators closely for any signs of reversal or overbought conditions.