Technical Analysis of BMO 2024-05-31
Overview:
In analyzing the technical indicators for BMO over the last 5 days, we will delve into the trend, momentum, volatility, and volume indicators to provide a comprehensive outlook on the possible stock price movement in the coming days. By examining these key aspects, we aim to offer valuable insights and predictions for informed decision-making.
Trend Analysis:
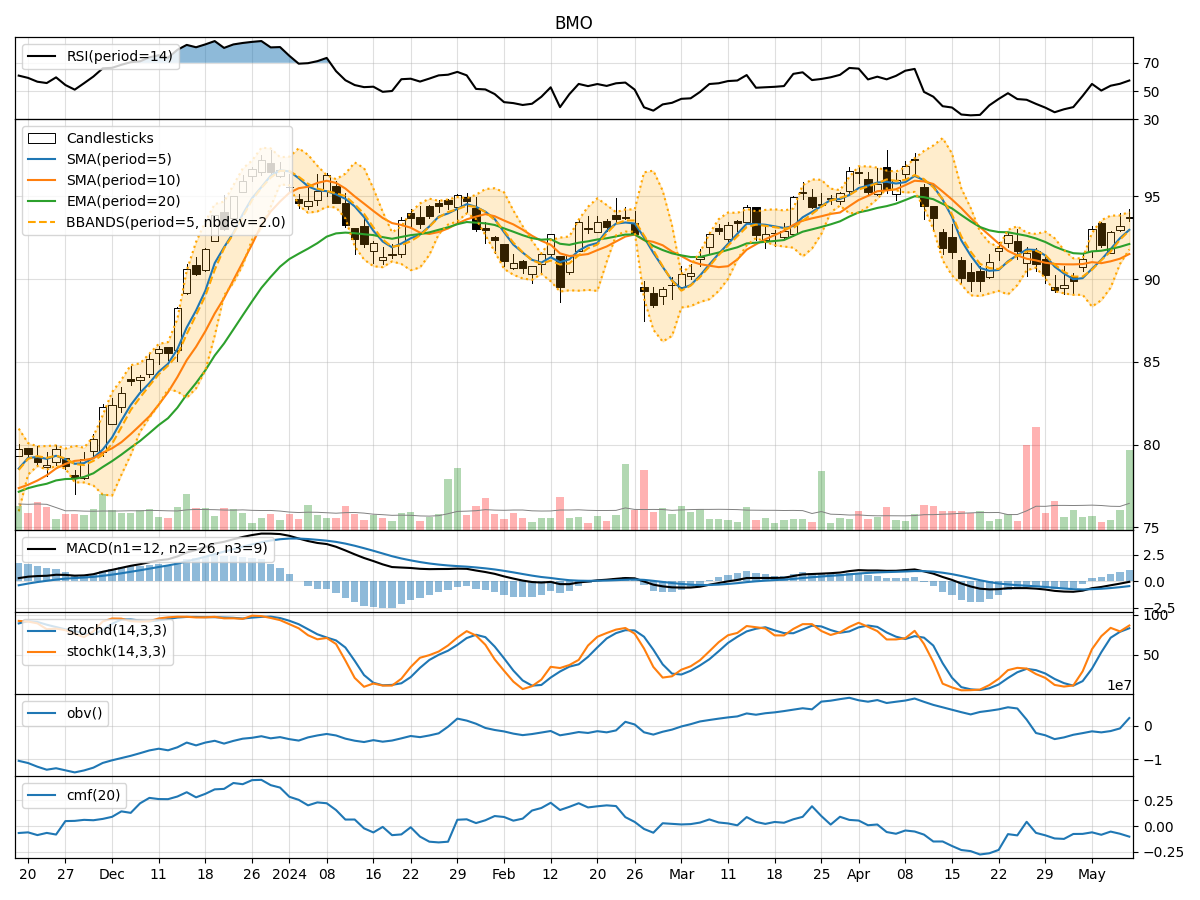
- Moving Averages (MA): The 5-day Moving Average (MA) has been fluctuating around the Simple Moving Average (SMA) and Exponential Moving Average (EMA) values, indicating a lack of clear trend direction.
- MACD: The Moving Average Convergence Divergence (MACD) has shown a decreasing trend in the MACD line compared to the Signal line, suggesting a potential bearish signal.
- Conclusion: The trend indicators point towards a bearish sentiment in the short term.
Momentum Analysis:
- RSI: The Relative Strength Index (RSI) has been oscillating within the neutral range, indicating a lack of strong momentum in either direction.
- Stochastic Oscillator: Both %K and %D values have been declining, signaling a potential weakening of buying pressure.
- Conclusion: The momentum indicators suggest a neutral to bearish momentum in the near future.
Volatility Analysis:
- Bollinger Bands (BB): The Bollinger Bands have shown a narrowing of the bands, indicating decreasing volatility in the stock price.
- Conclusion: The volatility indicators suggest a decreasing level of volatility, potentially leading to a period of consolidation.
Volume Analysis:
- On-Balance Volume (OBV): The OBV has been fluctuating, indicating a balance between buying and selling pressure.
- Chaikin Money Flow (CMF): The CMF has been negative, suggesting a net outflow of money from the stock.
- Conclusion: The volume indicators imply a neutral to bearish sentiment in terms of volume flow.
Overall Conclusion:
Based on the analysis of trend, momentum, volatility, and volume indicators, the overall outlook for BMO in the next few days leans towards a bearish sentiment. The trend indicators show a potential bearish signal, while momentum and volume indicators suggest a lack of strong buying pressure and a net outflow of money from the stock. The decreasing volatility also points towards a period of consolidation. Therefore, it is advisable to exercise caution and consider potential downside risks in the coming days.
Key Takeaways:
- Direction: Bearish
- Momentum: Neutral to Bearish
- Volatility: Decreasing
- Volume: Neutral to Bearish
In conclusion, a prudent approach would be to closely monitor the stock price movement, set appropriate stop-loss levels, and consider potential short-term bearish scenarios in your trading strategy.