Technical Analysis of COHR 2024-05-31
Overview:
In analyzing the technical indicators for COHR over the last 5 days, we will delve into the trend, momentum, volatility, and volume indicators to provide a comprehensive outlook on the possible stock price movement in the coming days. By examining these key indicators, we aim to offer valuable insights and predictions for potential investors.
Trend Analysis:
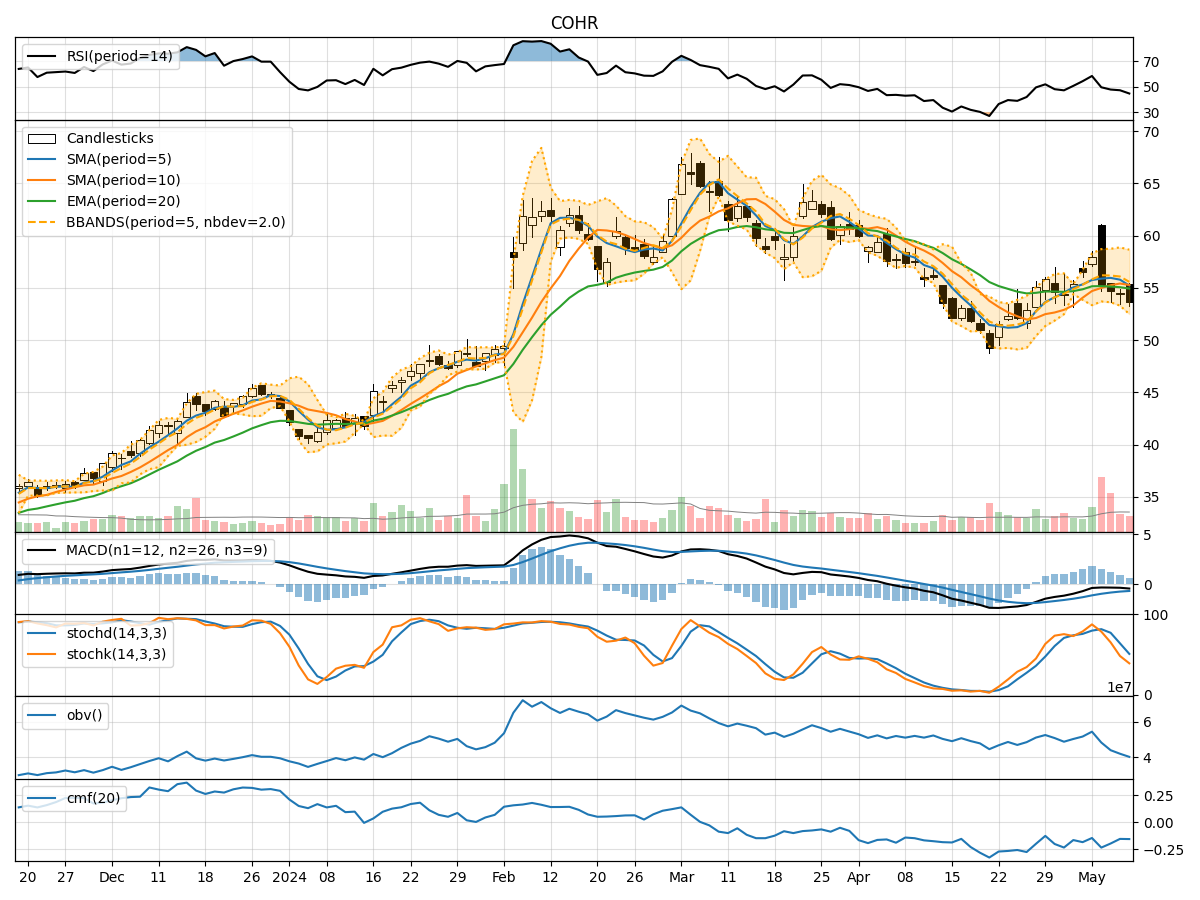
- Moving Averages (MA): The 5-day MA has been fluctuating around the closing prices, indicating short-term price trends. The SMA(10) and EMA(20) have shown a slight upward trend, suggesting a positive momentum in the medium to long term.
- MACD and Signal Line: The MACD has been positive, with the MACD line consistently above the signal line, indicating a bullish trend.
- MACD Histogram: The MACD histogram has been increasing, reflecting strengthening bullish momentum.
Momentum Analysis:
- RSI: The RSI has been fluctuating but generally staying above 50, indicating a bullish sentiment.
- Stochastic Oscillator: Both %K and %D have been in the overbought zone, suggesting a potential reversal or consolidation.
- Williams %R: The Williams %R has been in the oversold territory, indicating a possible buying opportunity.
Volatility Analysis:
- Bollinger Bands: The stock price has been trading within the Bollinger Bands, with the bands widening recently, suggesting increased volatility.
- Bollinger %B: The %B indicator has been fluctuating around 0.5, indicating a neutral position between the bands.
Volume Analysis:
- On-Balance Volume (OBV): The OBV has been declining, indicating a potential distribution phase.
- Chaikin Money Flow (CMF): The CMF has been negative, suggesting selling pressure in the market.
Key Observations:
- The trend indicators suggest a bullish sentiment in the short to medium term.
- Momentum indicators show mixed signals, with potential for a reversal or consolidation.
- Volatility has increased, indicating potential price swings.
- Volume indicators point towards a distribution phase and selling pressure.
Conclusion:
Based on the analysis of the technical indicators, the stock price of COHR is likely to experience further upward movement in the short to medium term. However, caution is advised as momentum indicators show signs of potential reversal or consolidation. Increased volatility may lead to price swings, and the negative volume indicators suggest a cautious approach. Investors should closely monitor the price action and key support/resistance levels for timely decision-making.
Recommendation:
- Short-term Traders: Consider taking advantage of the bullish trend but be prepared for potential reversals.
- Long-term Investors: Monitor the price action closely and consider accumulating on dips with a long-term perspective.
- Risk Management: Implement stop-loss orders to protect gains and manage risks effectively.
In conclusion, while the overall outlook is bullish, it is essential to remain vigilant and adapt to changing market conditions for successful trading or investment decisions.