Technical Analysis of CSL 2024-05-31
Overview:
In analyzing the technical indicators for CSL over the last 5 days, we will delve into the trend, momentum, volatility, and volume indicators to provide a comprehensive outlook on the possible stock price movement in the coming days. By examining these key indicators, we aim to offer valuable insights and predictions for informed decision-making.
Trend Analysis:
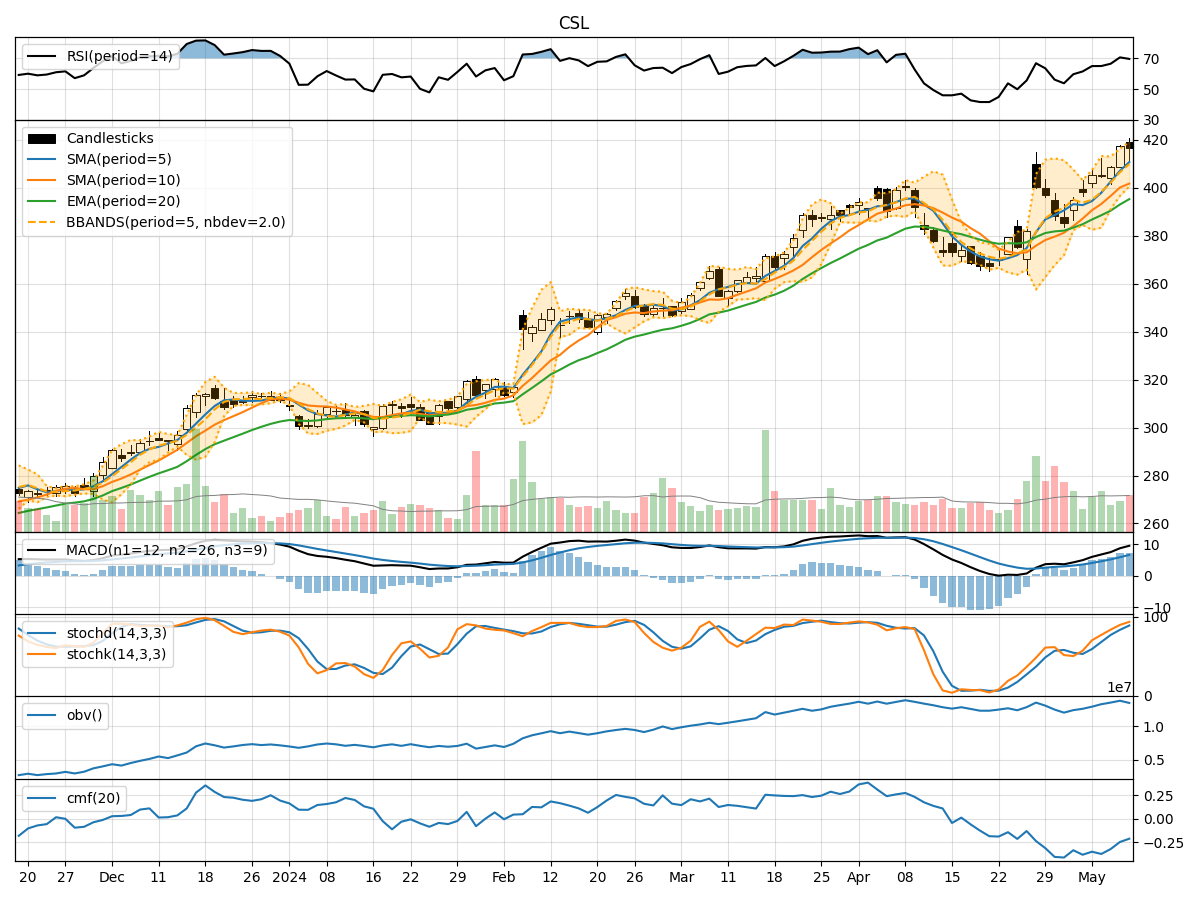
- Moving Averages (MA): The 5-day Moving Average (MA) has been fluctuating around the 420-425 range, indicating a relatively stable trend in the short term.
- MACD: The Moving Average Convergence Divergence (MACD) has shown a decreasing trend, with the MACD line moving below the signal line, suggesting a potential bearish signal.
- EMA: The Exponential Moving Average (EMA) has been on a slight uptrend, indicating a gradual increase in the stock price over the longer term.
Momentum Analysis:
- RSI: The Relative Strength Index (RSI) has been hovering around 55-70, signifying a neutral to slightly bullish momentum.
- Stochastic Oscillator: Both %K and %D have been declining, indicating a weakening momentum and potential oversold conditions.
- Williams %R: The Williams %R has been fluctuating in the oversold territory, suggesting a bearish sentiment.
Volatility Analysis:
- Bollinger Bands: The Bollinger Bands have been narrowing, indicating decreasing volatility and a potential period of consolidation.
- Bollinger %B: The %B indicator has been hovering around 0.2-0.4, suggesting a neutral stance in terms of volatility.
Volume Analysis:
- On-Balance Volume (OBV): The OBV has shown mixed signals, with fluctuations in volume accumulation, indicating indecision among market participants.
- Chaikin Money Flow (CMF): The CMF has been negative, reflecting selling pressure and a bearish sentiment in the market.
Conclusion:
Based on the analysis of the technical indicators, the stock price of CSL is likely to experience sideways movement in the coming days. The trend indicators suggest a mixed outlook, with a potential bearish bias indicated by the MACD. Momentum indicators point towards a neutral to slightly bearish sentiment, while volatility indicators signal a period of consolidation. Volume indicators reflect indecision among investors, further supporting the sideways view.
In conclusion, the next few days for CSL are expected to see sideways movement with a potential bearish bias. Traders and investors should closely monitor key support and resistance levels for potential entry and exit points, considering the overall market sentiment and broader economic factors.