Technical Analysis of DCI 2024-05-31
Overview:
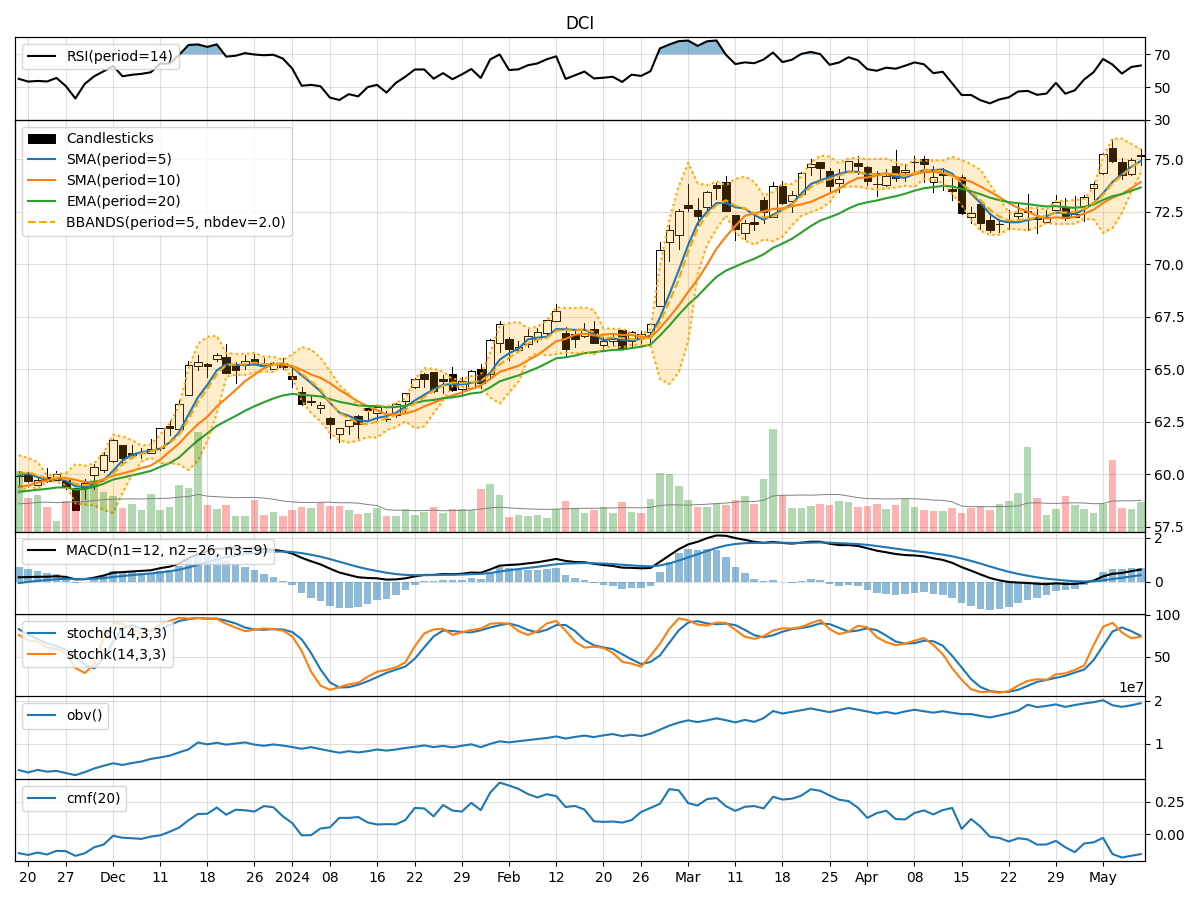
In analyzing the technical indicators for DCI over the last 5 days, we will delve into the trend, momentum, volatility, and volume indicators to provide a comprehensive outlook on the possible stock price movement in the coming days. By examining these key indicators, we aim to offer valuable insights and predictions for potential investors.
Trend Indicators:
- Moving Averages (MA): The 5-day MA has been consistently below the closing prices, indicating a short-term downtrend.
- MACD: The MACD line has been below the signal line, suggesting a bearish momentum.
- RSI: The RSI has been fluctuating around the 50 level, indicating a lack of strong trend direction.
Key Observation: The trend indicators point towards a bearish sentiment in the short term.
Momentum Indicators:
- Stochastic Oscillator: Both %K and %D have been trending downwards, signaling a potential oversold condition.
- Williams %R: The indicator has been hovering in the oversold territory, indicating a possible reversal.
Key Observation: Momentum indicators suggest a potential reversal or consolidation in the near future.
Volatility Indicators:
- Bollinger Bands: The price has been trading within the bands, with the bands narrowing, indicating decreasing volatility.
- Bollinger %B: The %B indicator has been fluctuating around the midline, suggesting a lack of clear trend direction.
Key Observation: Volatility is decreasing, and the price is consolidating within a tight range.
Volume Indicators:
- On-Balance Volume (OBV): The OBV has been declining, indicating selling pressure.
- Chaikin Money Flow (CMF): The CMF has been negative, suggesting a lack of buying interest.
Key Observation: Volume indicators reflect a bearish sentiment with more selling pressure.
Conclusion:
Based on the analysis of the technical indicators, the overall outlook for DCI in the next few days is bearish. The trend indicators, momentum indicators, volatility indicators, and volume indicators collectively suggest a potential continuation of the current downtrend or a period of consolidation with a bearish bias. Investors should exercise caution and consider waiting for more definitive signals before making any trading decisions.
Key Conclusion:
- Bearish Outlook: The technical indicators point towards a bearish sentiment in the short term, with potential for further downside or consolidation.
- Caution Advised: Investors are recommended to monitor the price action closely and wait for clearer signals before entering any positions.
By carefully considering these technical indicators and their implications, investors can make more informed decisions in navigating the market dynamics of DCI.