Technical Analysis of EC 2024-05-31
Overview:
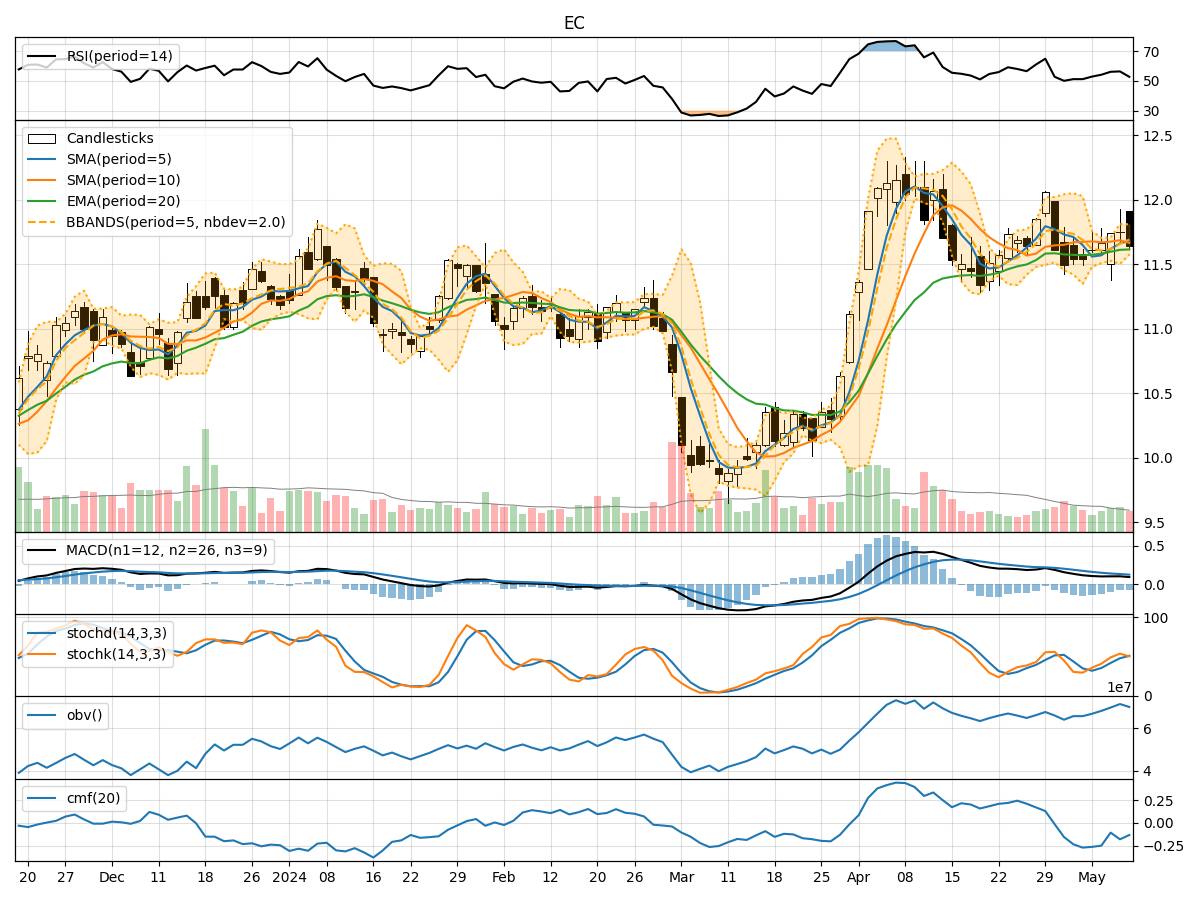
In analyzing the technical indicators for EC stock over the last 5 days, we will delve into the trend, momentum, volatility, and volume indicators to provide a comprehensive outlook on the possible stock price movement in the coming days.
Trend Indicators:
- Moving Averages (MA): The 5-day MA has been fluctuating around the 12.05 level, indicating a relatively stable trend in the short term.
- MACD: The MACD line has been consistently positive, suggesting bullish momentum in the stock.
- EMA: The EMA has been on an upward trajectory, indicating a positive trend in the stock price.
Key Observation: The trend indicators suggest a bullish sentiment in the stock price.
Momentum Indicators:
- RSI: The RSI has been hovering around 60, indicating a neutral momentum in the stock.
- Stochastic Oscillator: Both %K and %D have been fluctuating but staying in the overbought territory, suggesting a potential reversal in momentum.
- Williams %R: The Williams %R has been oscillating around -20, indicating a neutral momentum.
Key Observation: The momentum indicators show a mixed sentiment with a slight bias towards a potential reversal in momentum.
Volatility Indicators:
- Bollinger Bands: The stock price has been trading within the Bollinger Bands, indicating a period of consolidation.
- Bollinger %B: The %B indicator has been fluctuating around 0.5, suggesting a balanced volatility level.
- Average True Range (ATR): The ATR has been relatively stable, indicating consistent volatility in the stock.
Key Observation: The volatility indicators point towards a period of consolidation and stable volatility.
Volume Indicators:
- On-Balance Volume (OBV): The OBV has been fluctuating, indicating mixed buying and selling pressure.
- Chaikin Money Flow (CMF): The CMF has been negative, suggesting a slight distribution phase in the stock.
Key Observation: The volume indicators reflect mixed sentiment with a slight bias towards selling pressure.
Conclusion:
Based on the analysis of the technical indicators, the stock price of EC is likely to experience sideways movement in the coming days. The bullish trend indicated by the moving averages and MACD is counterbalanced by the neutral to slightly bearish momentum and mixed volume indicators. The volatility indicators suggest a period of consolidation, further supporting the sideways movement hypothesis.
Overall, the stock price of EC is expected to consolidate in the near term with no clear directional bias. Investors should closely monitor key support and resistance levels for potential breakout opportunities.