Technical Analysis of GENI 2024-05-31
Overview:
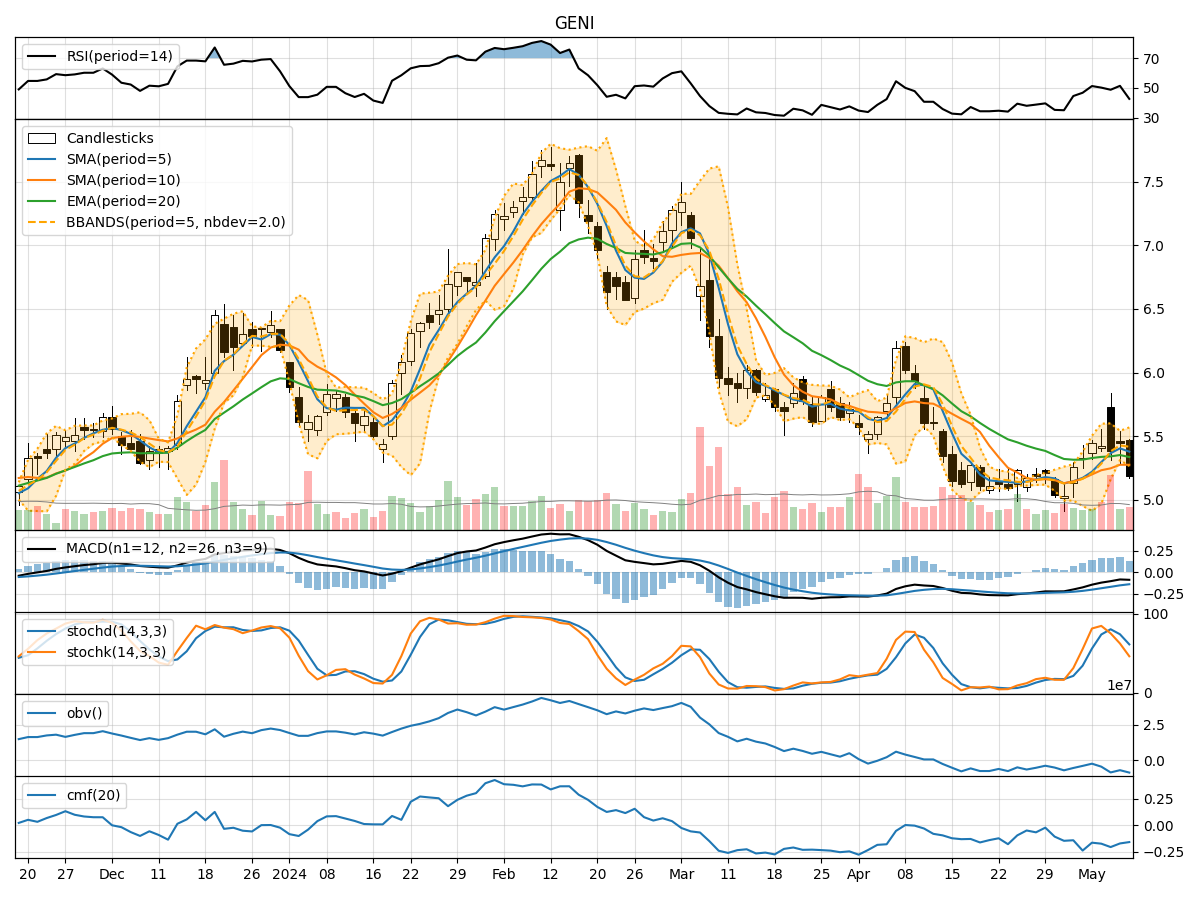
In analyzing the technical indicators for GENI over the last 5 days, we will delve into the trend, momentum, volatility, and volume indicators to provide a comprehensive outlook on the possible stock price movement in the coming days. By examining these key aspects, we aim to offer valuable insights and predictions for potential investors.
Trend Analysis:
- Moving Averages (MA): The 5-day MA has been declining steadily, indicating a bearish trend in the short term.
- MACD: The MACD line has been consistently below the signal line, suggesting a bearish momentum.
- Relative Strength Index (RSI): The RSI has been fluctuating around the midline, indicating indecision in the market.
Key Observation: The trend indicators point towards a bearish sentiment in the stock price movement.
Momentum Analysis:
- Stochastic Oscillator: Both %K and %D have been trending downwards, signaling a bearish momentum.
- Williams %R (WillR): The indicator has been in oversold territory, indicating a potential reversal.
Key Observation: Momentum indicators align with the bearish trend in the stock price.
Volatility Analysis:
- Bollinger Bands (BB): The stock price has been trading within the lower Bollinger Band, suggesting a period of low volatility.
- Bollinger %B (BBP): The %B indicator has been below 0.2, indicating an oversold condition.
Key Observation: Volatility indicators imply a sideways movement or a potential reversal in the stock price.
Volume Analysis:
- On-Balance Volume (OBV): The OBV has been declining, reflecting selling pressure in the stock.
- Chaikin Money Flow (CMF): The CMF has been positive but decreasing, indicating weakening buying pressure.
Key Observation: Volume indicators support the bearish sentiment in the stock price.
Conclusion:
Based on the analysis of trend, momentum, volatility, and volume indicators, the overall outlook for GENI suggests a continuation of the bearish trend in the coming days. The stock price is likely to experience further downward movement, potentially reaching lower support levels. Investors should exercise caution and consider waiting for a more favorable entry point before considering any long positions.
Key Conclusion: The stock is expected to continue its downward trajectory in the near term.