Technical Analysis of HBM 2024-05-31
Overview:
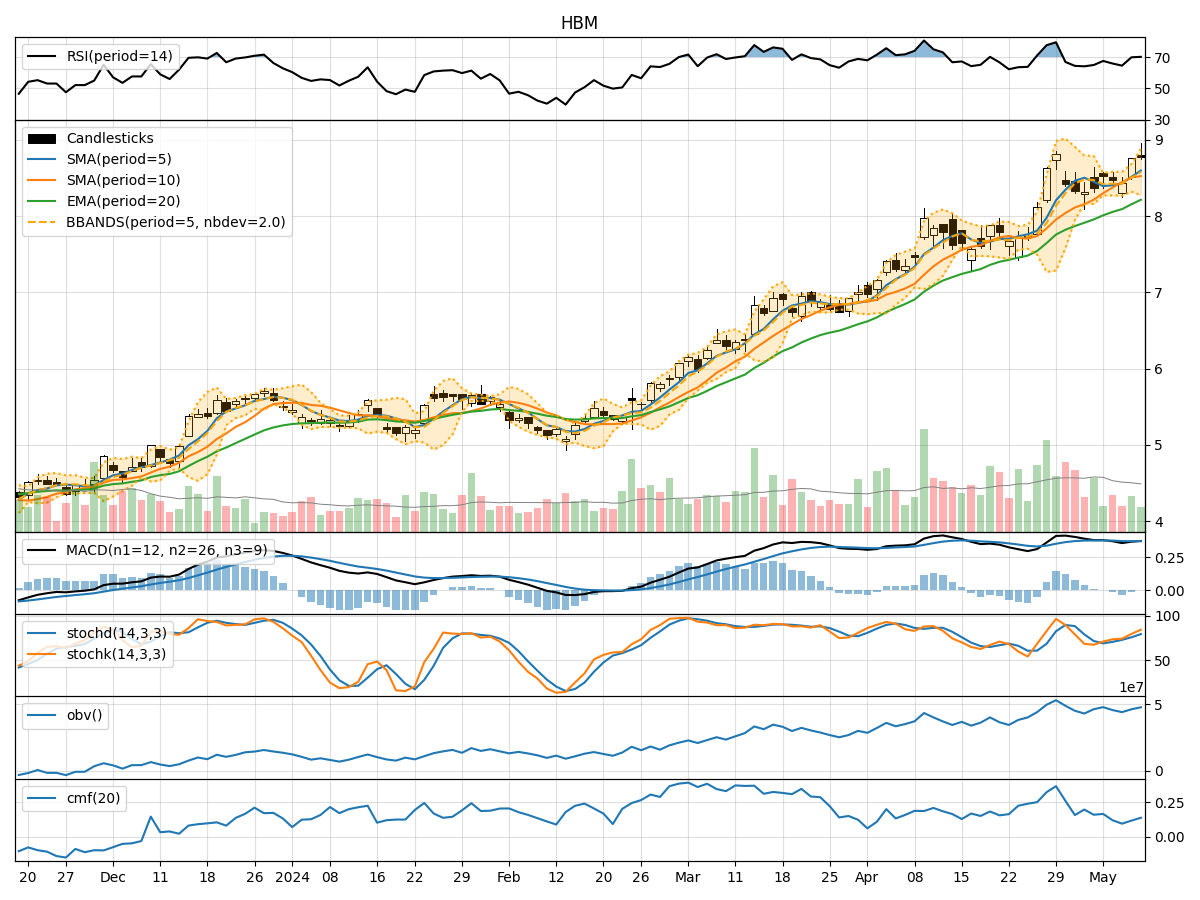
In the last 5 trading days, HBM stock has shown mixed signals across various technical indicators. The stock price has fluctuated within a narrow range, indicating indecision in the market. By analyzing trend, momentum, volatility, and volume indicators, we can gain insights into the potential future price movement of HBM stock.
Trend Analysis:
- Moving Averages (MA): The 5-day MA has been fluctuating around the 10-day SMA, indicating a lack of clear trend direction.
- MACD: The MACD line has been positive but decreasing, while the MACD histogram has been in negative territory, suggesting a weakening bullish momentum.
- EMA: The EMA has been gradually increasing, indicating a potential bullish trend.
Momentum Analysis:
- RSI: The RSI has been hovering around 60, indicating a neutral momentum.
- Stochastic Oscillator: Both %K and %D have been fluctuating, showing indecision in momentum.
- Williams %R: The Williams %R has been in oversold territory, suggesting a potential reversal.
Volatility Analysis:
- Bollinger Bands (BB): The bands have been narrowing, indicating decreasing volatility.
- BB %B: The %B has been fluctuating around 0.5, suggesting a balanced market sentiment.
Volume Analysis:
- On-Balance Volume (OBV): The OBV has been fluctuating, indicating mixed buying and selling pressure.
- Chaikin Money Flow (CMF): The CMF has been negative, indicating potential distribution.
Key Observations:
- The stock is currently in a consolidation phase with no clear trend direction.
- Momentum indicators suggest a neutral stance with a slight bearish bias.
- Volatility has been decreasing, indicating a potential breakout or breakdown.
- Volume indicators show mixed signals, reflecting uncertainty among market participants.
Conclusion:
Based on the analysis of technical indicators, the next few days' possible stock price movement for HBM is sideways consolidation with a slight bearish bias. Traders should exercise caution and wait for a clear trend to emerge before making significant trading decisions. Keep a close watch on key support and resistance levels for potential breakout or breakdown scenarios.