Technical Analysis of HHH 2024-05-31
Overview:
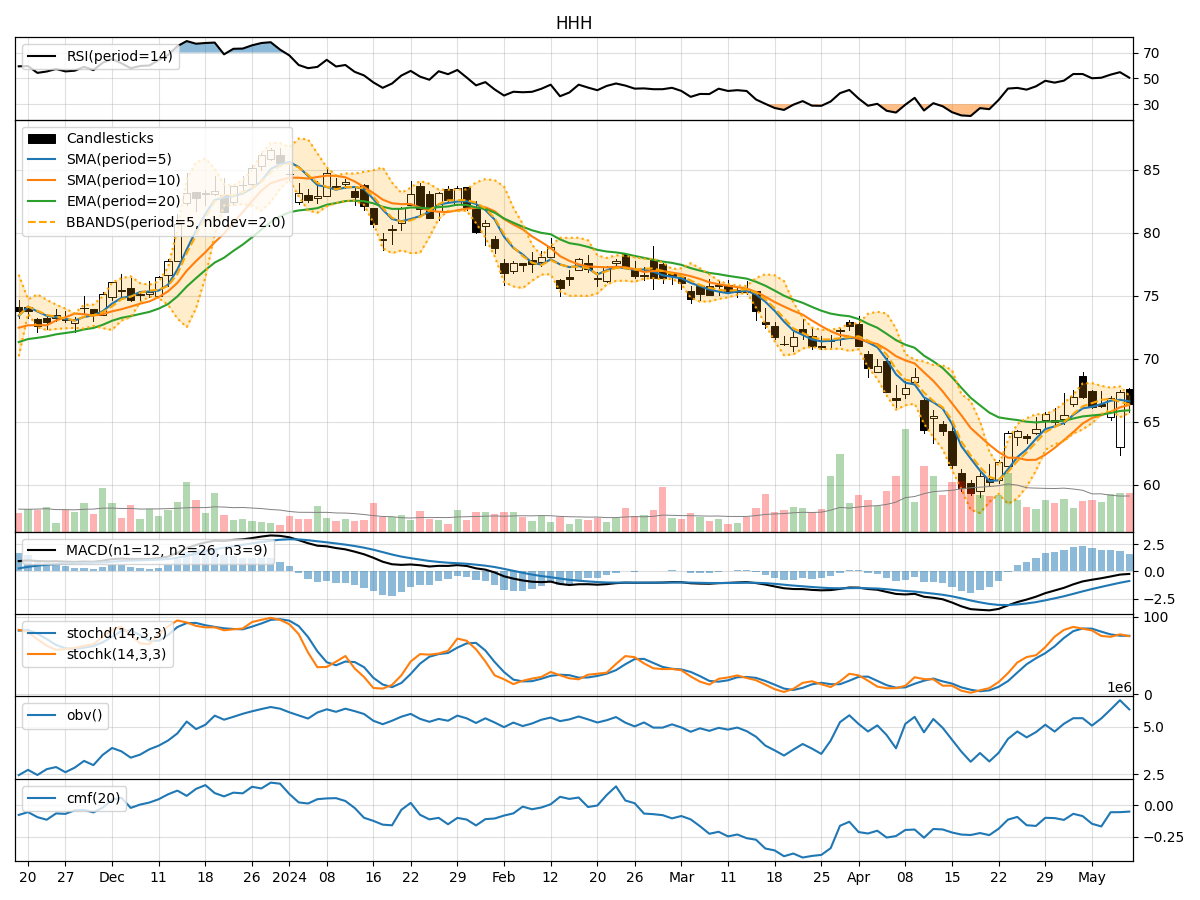
In analyzing the technical indicators for the stock with the symbol HHH over the last 5 days, we will delve into the trend, momentum, volatility, and volume indicators to provide a comprehensive outlook on the possible stock price movement in the upcoming days.
Trend Analysis:
- Moving Averages (MA): The 5-day Moving Average (MA) has been consistently below the closing prices, indicating a short-term downtrend.
- MACD: The Moving Average Convergence Divergence (MACD) has been negative, with the MACD line below the signal line, suggesting bearish momentum.
- EMA: The Exponential Moving Average (EMA) has been declining, further supporting the bearish trend.
Momentum Analysis:
- RSI: The Relative Strength Index (RSI) has been below 50, indicating bearish momentum.
- Stochastic Oscillator: Both %K and %D have been trending downwards, signaling a potential continuation of the bearish momentum.
- Williams %R: The Williams %R has been in oversold territory, suggesting a possible reversal or continuation of the downtrend.
Volatility Analysis:
- Bollinger Bands (BB): The stock price has been trading within the lower Bollinger Band, indicating lower volatility and a potential oversold condition.
- Bollinger Band Width: The Band Width has been narrowing, suggesting a potential decrease in volatility.
Volume Analysis:
- On-Balance Volume (OBV): The OBV has been declining, indicating selling pressure and potential bearish sentiment.
- Chaikin Money Flow (CMF): The CMF has been negative, reflecting outflow of money from the stock.
Key Observations and Opinions:
- Trend: The trend indicators suggest a bearish sentiment in the short term.
- Momentum: Momentum indicators align with the bearish trend, indicating potential further downside.
- Volatility: Volatility has been decreasing, potentially signaling a period of consolidation or a reversal.
- Volume: The declining OBV and negative CMF point towards bearish market participation.
Conclusion:
Based on the analysis of the technical indicators, the stock HHH is likely to experience further downward movement in the upcoming days. The bearish trend, supported by momentum indicators and volume analysis, suggests that investors may continue to sell the stock. Traders should exercise caution and consider shorting or staying on the sidelines until a clear reversal pattern emerges.