Technical Analysis of HUN 2024-05-31
Overview:
In analyzing the technical indicators for HUN stock over the last 5 days, we will delve into the trend, momentum, volatility, and volume indicators to provide a comprehensive outlook on the possible stock price movement in the coming days. By examining these key indicators, we aim to offer valuable insights and predictions to guide investment decisions.
Trend Analysis:
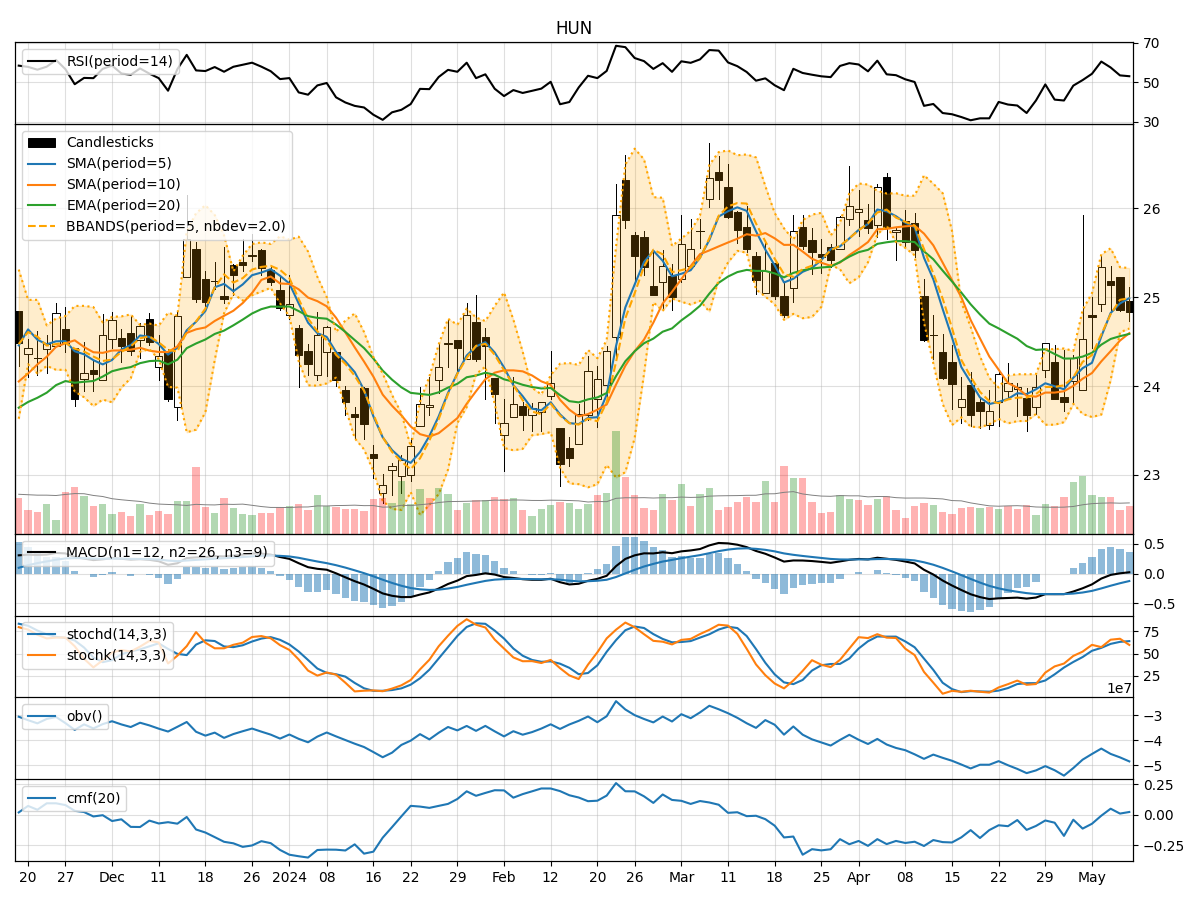
- Moving Averages (MA): The 5-day MA has been gradually decreasing, indicating a short-term bearish trend.
- MACD: The MACD line has been positive but decreasing, while the MACD Histogram has been consistently negative, suggesting a weakening bullish momentum.
- EMA: The EMA has been declining, reflecting a bearish sentiment in the stock.
Momentum Analysis:
- RSI: The RSI has been fluctuating around the 50 level, indicating a lack of strong momentum in either direction.
- Stochastic Oscillator: Both %K and %D have been relatively low, signaling a potential oversold condition.
- Williams %R: The Williams %R has been in the oversold territory, suggesting a possible reversal in the stock price.
Volatility Analysis:
- Bollinger Bands (BB): The stock price has been trading within the lower Bollinger Band, indicating a period of low volatility.
- Bollinger Band Width: The Band Width has been narrowing, suggesting a potential breakout or significant price movement ahead.
Volume Analysis:
- On-Balance Volume (OBV): The OBV has been decreasing, indicating selling pressure in the stock.
- Chaikin Money Flow (CMF): The CMF has been negative, reflecting a bearish money flow in the stock.
Key Observations and Opinions:
- Trend: The trend indicators point towards a bearish sentiment in the short term.
- Momentum: The momentum indicators suggest a lack of strong directional momentum, with a potential for a reversal.
- Volatility: The narrowing Bollinger Bands indicate a period of consolidation and a potential breakout.
- Volume: The declining OBV and negative CMF signal bearish sentiment and selling pressure in the stock.
Conclusion:
Based on the analysis of the technical indicators, the next few days' possible stock price movement for HUN is likely to be bearish in the short term. The stock may experience further downside pressure, potentially leading to a downward trend. Traders and investors should exercise caution and consider waiting for a clearer signal before making any significant trading decisions.