Technical Analysis of IAG 2024-05-31
Overview:
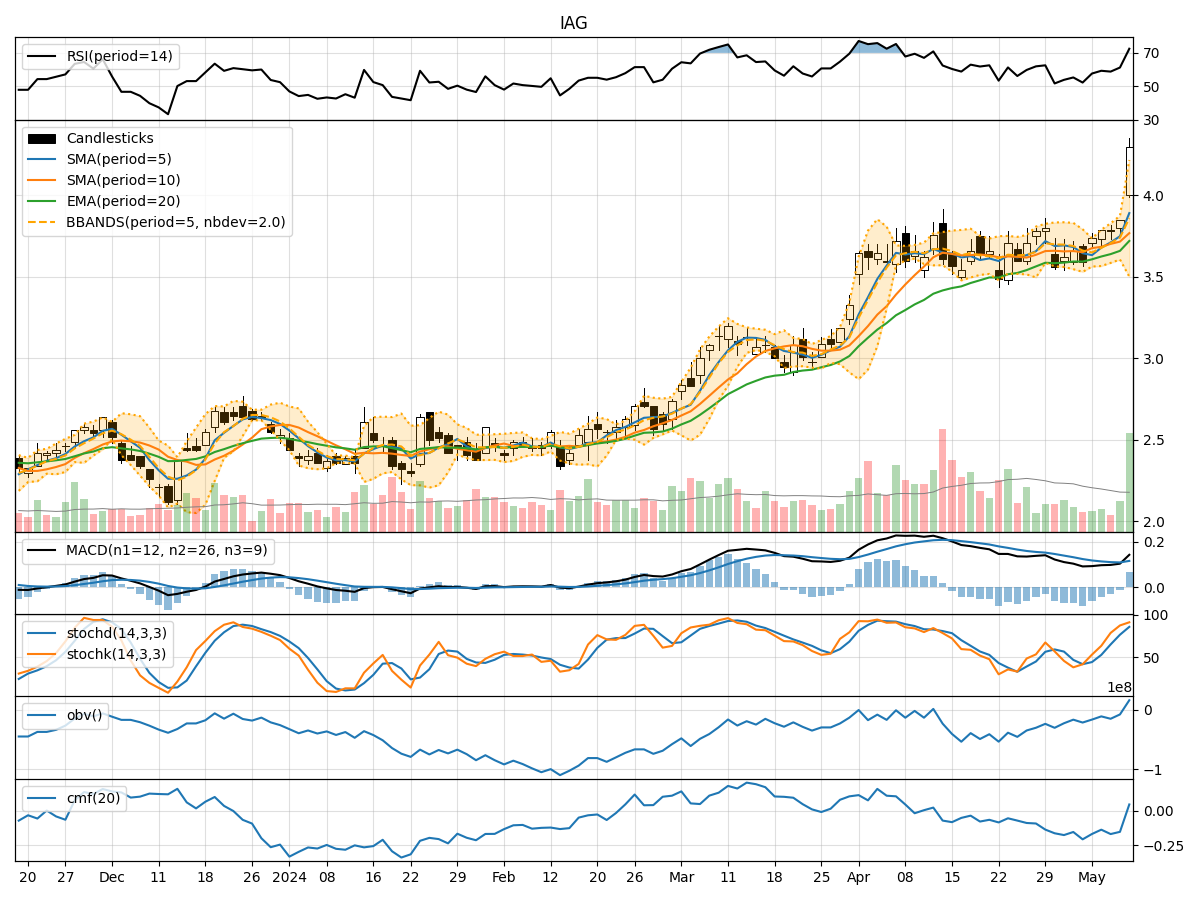
In analyzing the technical indicators for IAG over the last 5 days, we will delve into the trend, momentum, volatility, and volume indicators to provide a comprehensive outlook on the possible stock price movement. By examining these key factors, we aim to offer valuable insights and predictions for the upcoming days.
Trend Analysis:
- Moving Averages (MA): The 5-day MA has been consistently below the closing price, indicating a short-term bearish trend.
- MACD: The MACD line has been decreasing, with the MACD line below the signal line, suggesting a bearish momentum.
- EMA: The EMA has been declining, reflecting a bearish sentiment in the stock.
Key Observation: The trend indicators point towards a bearish outlook for IAG in the short term.
Momentum Analysis:
- RSI: The RSI has been fluctuating around the 50 level, indicating a lack of strong momentum in either direction.
- Stochastic Oscillator: Both %K and %D have been decreasing, signaling a weakening momentum.
- Williams %R: The indicator has been in oversold territory, suggesting a potential reversal.
Key Observation: Momentum indicators suggest a neutral to slightly bearish sentiment for IAG.
Volatility Analysis:
- Bollinger Bands: The stock price has been trading within the bands, indicating moderate volatility.
- Bollinger %B: The %B has been fluctuating around the midline, reflecting a balanced volatility level.
Key Observation: Volatility indicators suggest a stable market environment for IAG.
Volume Analysis:
- On-Balance Volume (OBV): The OBV has been fluctuating, indicating indecision among investors.
- Chaikin Money Flow (CMF): The CMF has been positive but decreasing, signaling potential selling pressure.
Key Observation: Volume indicators point towards mixed sentiment among market participants.
Conclusion:
Based on the analysis of trend, momentum, volatility, and volume indicators, the overall outlook for IAG in the next few days is bearish. The trend indicators, supported by weakening momentum signals, suggest a potential downward movement in the stock price. While volatility remains stable, the volume indicators indicate a lack of strong conviction among investors.
Key Conclusion: The next few days are likely to see a downward movement in IAG's stock price, with a potential for further decline. Investors should exercise caution and consider risk management strategies in their trading decisions.