Technical Analysis of JWN 2024-05-31
Overview:
In analyzing the technical indicators for JWN over the last 5 days, we will delve into the trend, momentum, volatility, and volume indicators to provide a comprehensive outlook on the possible stock price movement in the coming days. By examining these key aspects, we aim to offer valuable insights and predictions to guide investment decisions.
Trend Analysis:
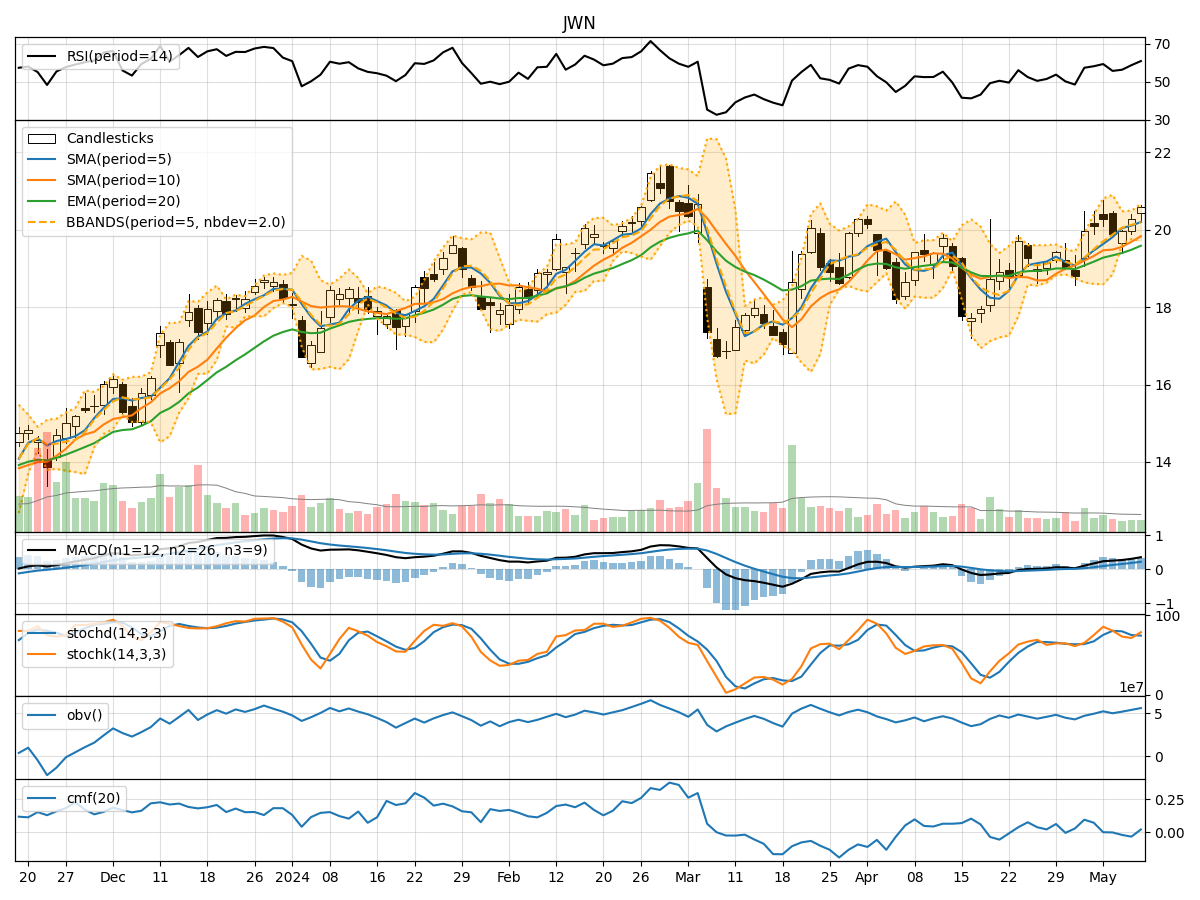
- Moving Averages (MA): The 5-day Moving Average (MA) has been fluctuating around the closing prices, indicating short-term price trends. The Simple Moving Average (SMA) and Exponential Moving Average (EMA) show a slight uptrend, with the EMA being more responsive to recent price changes.
- MACD: The Moving Average Convergence Divergence (MACD) and its signal line have been close to each other, suggesting a potential trend reversal or consolidation.
- MACD Histogram: The MACD Histogram has been oscillating around the zero line, indicating indecision in the market.
Momentum Analysis:
- RSI: The Relative Strength Index (RSI) has shown fluctuations but has not entered overbought or oversold territory, indicating a balanced momentum.
- Stochastic Oscillator: Both %K and %D lines of the Stochastic Oscillator have been moving erratically, reflecting uncertainty in price momentum.
- Williams %R: The Williams %R has been hovering near oversold levels, suggesting a potential buying opportunity.
Volatility Analysis:
- Bollinger Bands (BB): The Bollinger Bands have widened recently, indicating increased price volatility. The current price is near the upper band, suggesting a potential overbought condition.
- Bollinger %B: The %B indicator is close to 1, indicating a relatively high price compared to recent movements.
Volume Analysis:
- On-Balance Volume (OBV): The OBV has shown mixed signals, with fluctuations in volume accumulation. This could indicate indecision among market participants.
- Chaikin Money Flow (CMF): The CMF has been positive, indicating buying pressure in the market over the past 20 days.
Key Observations:
- The trend indicators suggest a potential consolidation phase or trend reversal.
- Momentum indicators show mixed signals, with no clear direction in price momentum.
- Volatility has increased, indicating potential price swings in the near term.
- Volume indicators reflect uncertainty and mixed participation from investors.
Conclusion:
Based on the analysis of the technical indicators, the stock price of JWN is likely to experience sideways movement in the coming days. The volatility in prices may lead to short-term fluctuations, while the momentum remains indecisive. Traders should exercise caution and wait for clearer signals before taking significant positions. Overall, the outlook for JWN is neutral with a slight bearish bias in the short term.