Technical Analysis of LW 2024-05-31
Overview:
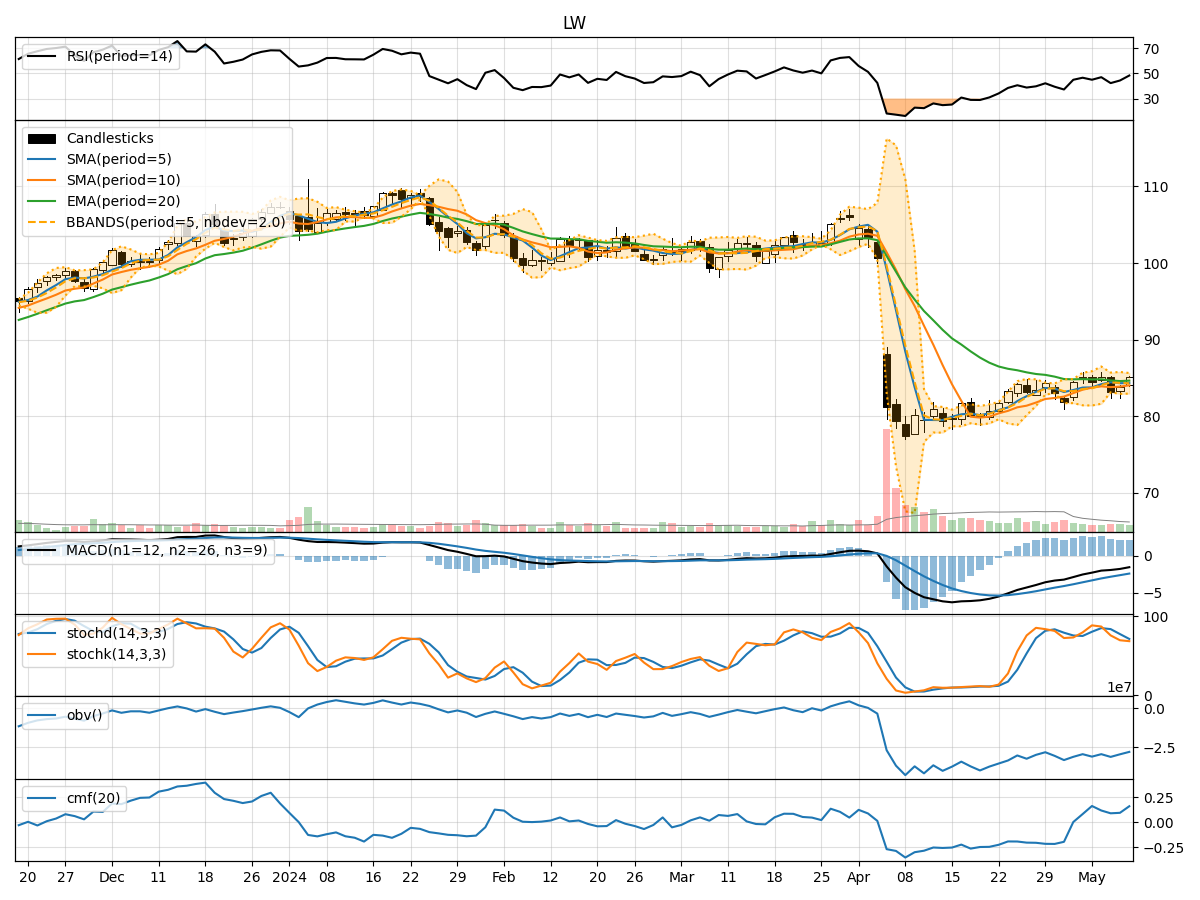
In analyzing the technical indicators for LW stock over the last 5 days, we will delve into the trend, momentum, volatility, and volume indicators to provide a comprehensive outlook on the possible stock price movement in the upcoming days. By examining these key indicators, we aim to offer valuable insights and predictions for potential investors.
Trend Analysis:
- Moving Averages (MA): The 5-day Moving Average (MA) has been fluctuating around the closing prices, indicating short-term price trends. The Simple Moving Average (SMA) and Exponential Moving Average (EMA) show a slight upward trend, suggesting a potential bullish sentiment.
- MACD: The Moving Average Convergence Divergence (MACD) and its signal line have been positive, indicating a bullish momentum in the stock price.
- Conclusion: The trend indicators suggest a bullish outlook for LW stock in the near term.
Momentum Analysis:
- RSI: The Relative Strength Index (RSI) has been fluctuating but remains above the oversold threshold of 30, indicating a potential buying momentum.
- Stochastic Oscillator: Both %K and %D have been declining, suggesting a weakening momentum.
- Conclusion: The momentum indicators show a mixed signal, with RSI indicating a potential buying opportunity while the Stochastic Oscillator signals caution.
Volatility Analysis:
- Bollinger Bands (BB): The Bollinger Bands have been widening, indicating increased volatility in the stock price.
- Conclusion: The volatility indicators suggest that LW stock is experiencing increased price fluctuations, which could lead to both upward and downward movements in the near future.
Volume Analysis:
- On-Balance Volume (OBV): The OBV has been declining, indicating a potential distribution phase where selling pressure is increasing.
- Chaikin Money Flow (CMF): The CMF has been positive, suggesting that money is flowing into the stock despite the declining OBV.
- Conclusion: The volume indicators present a mixed picture, with OBV signaling potential selling pressure and CMF indicating buying interest.
Overall Conclusion:
Based on the analysis of trend, momentum, volatility, and volume indicators, the bullish trend in the stock price is supported by the moving averages and MACD. However, the mixed signals from momentum and volume indicators suggest a cautious approach. The increased volatility indicates that the stock price may experience fluctuations in the upcoming days.
Recommendation:
Considering the overall analysis, it is advisable to monitor the stock closely for any signs of reversal or confirmation of the bullish trend. Investors should consider setting stop-loss levels to manage potential risks. Additionally, conducting further research on fundamental factors impacting LW stock would provide a more comprehensive view before making any investment decisions.