Technical Analysis of MA 2024-05-31
Overview:
In analyzing the provided MA TA data for the last 5 days, we will delve into the technical indicators across trend, momentum, volatility, and volume to derive insights into the possible future stock price movement. By examining these indicators, we aim to provide a comprehensive and well-informed prediction for the upcoming days.
Trend Analysis:
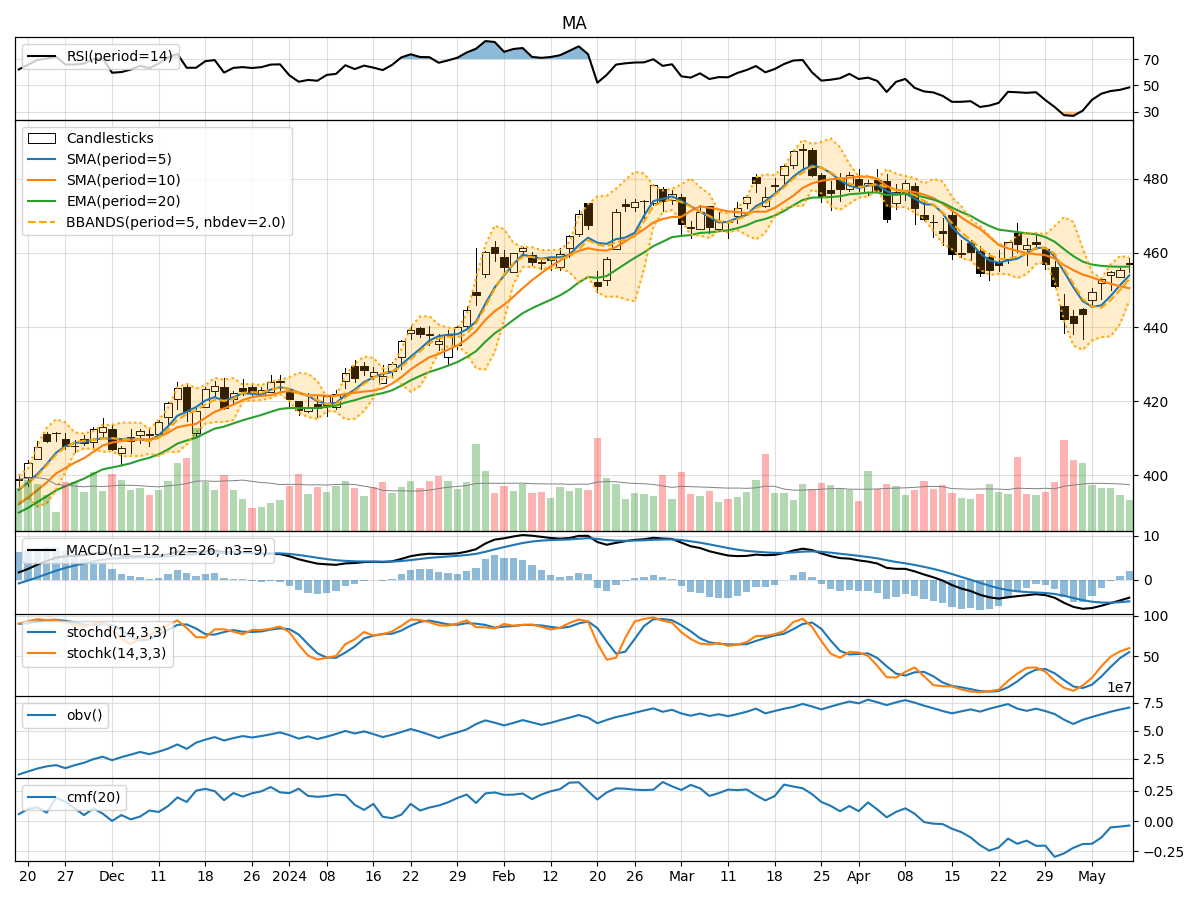
- Moving Averages (MA): The 5-day MA has been consistently decreasing, indicating a downward trend in the stock price.
- MACD: The MACD line has been negative, with the MACD histogram showing a decreasing trend, suggesting bearish momentum.
- EMA: The EMA has also been declining, further supporting the bearish trend in the stock.
Momentum Analysis:
- RSI: The RSI has been relatively low, indicating oversold conditions in the stock.
- Stochastic Oscillator: Both %K and %D have been trending downwards, signaling weakening momentum.
- Williams %R: The indicator has been in the oversold territory, suggesting a potential reversal.
Volatility Analysis:
- Bollinger Bands: The bands have been narrowing, indicating decreasing volatility in the stock price.
- Bollinger %B: The %B has been decreasing, reflecting the downward price movement and potential consolidation.
Volume Analysis:
- On-Balance Volume (OBV): The OBV has been negative, suggesting distribution and selling pressure in the stock.
- Chaikin Money Flow (CMF): The CMF has been positive but decreasing, indicating weakening buying pressure.
Key Observations:
- The stock is currently in a downtrend based on moving averages and MACD.
- Momentum indicators suggest the stock is oversold and may see a potential reversal.
- Volatility is decreasing, indicating a possible period of consolidation.
- Volume indicators show selling pressure and weakening buying interest.
Conclusion:
Based on the analysis of the technical indicators, the next few days' possible stock price movement is likely to be sideways to slightly bullish. The stock may experience a period of consolidation as it finds support at lower levels. Traders should watch for signs of a potential reversal in momentum indicators and monitor volume for any shifts in buying or selling pressure. It is essential to set stop-loss levels and closely monitor the stock's behavior for any changes in the established trends.