Technical Analysis of OGN 2024-05-31
Overview:
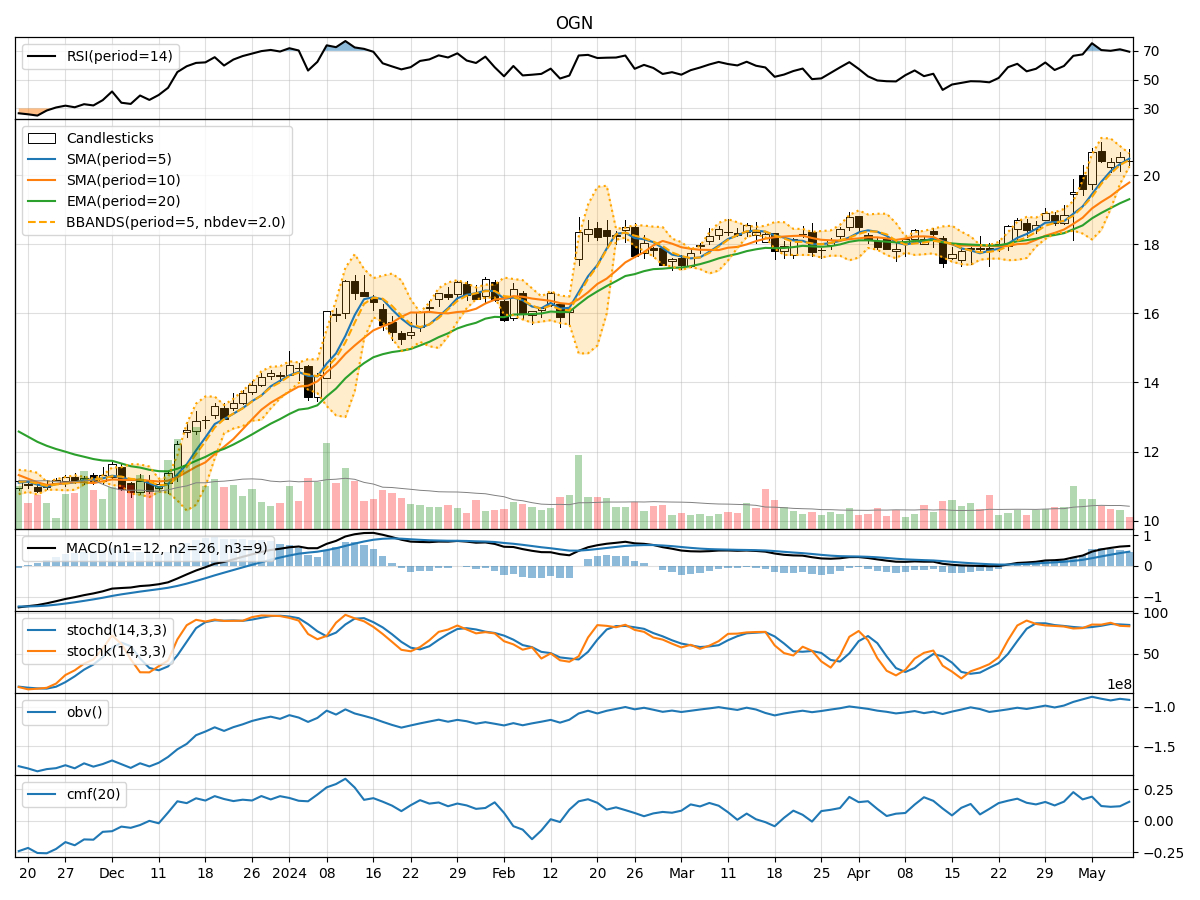
In analyzing the technical indicators for OGN over the last 5 days, we will delve into the trend, momentum, volatility, and volume indicators to provide a comprehensive outlook on the possible stock price movement in the coming days.
Trend Analysis:
- Moving Averages (MA): The 5-day Moving Average (MA) has been consistently below the closing prices, indicating a short-term downtrend.
- MACD: The MACD line has been decreasing, and the MACD Histogram has been negative, suggesting a weakening trend momentum.
Momentum Analysis:
- RSI: The Relative Strength Index (RSI) has been fluctuating around the neutral zone, indicating indecision in the market.
- Stochastic Oscillator: Both %K and %D have been declining, signaling a potential bearish momentum.
- Williams %R: The Williams %R is in the oversold territory, suggesting a possible reversal or continuation of the downtrend.
Volatility Analysis:
- Bollinger Bands (BB): The stock price has been trading within the lower Bollinger Band, indicating a potential oversold condition.
- Bollinger %B: The %B indicator has been below 1, suggesting a possible bounce back in price.
Volume Analysis:
- On-Balance Volume (OBV): The OBV has been fluctuating, indicating mixed buying and selling pressure.
- Chaikin Money Flow (CMF): The CMF has been positive, reflecting buying pressure in the market.
Key Observations:
- The trend indicators show a bearish sentiment with the MA below the closing prices and a declining MACD.
- Momentum indicators suggest a lack of strong momentum with RSI hovering around neutrality and stochastic indicators pointing towards a bearish bias.
- Volatility indicators indicate a potential oversold condition with the price near the lower Bollinger Band.
- Volume indicators show mixed signals with fluctuating OBV and positive CMF.
Conclusion:
Based on the analysis of the technical indicators, the outlook for OGN in the next few days is bearish. The trend indicators, momentum indicators, and volatility indicators all point towards a potential continuation of the downtrend. The stock price may experience further downside movement, possibly testing lower support levels. Traders and investors should exercise caution and consider waiting for more definitive signals before making any buying decisions.